Dutch researchers have developed 3D visualization software that fuses anatomical and functional data into a single image. They believe the fused images make it easier to diagnose cases of coronary artery disease (CAD), according to a paper in the January issue of the Journal of Nuclear Medicine.
The synchronized multimodal heart visualization (SMARTVis) software is designed to take information from multiple cardiac imaging modalities and create 2D and 3D fused images with anatomic and functional information on coronary stenosis. This essentially creates a one-stop shop for cardiac imaging that could be an improvement over analyzing images separately.
SMARTVis can also automatically detect and rank stenoses, as well as estimate patient-specific coronary perfusion territories.
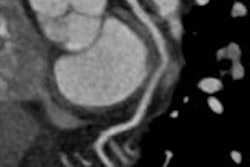
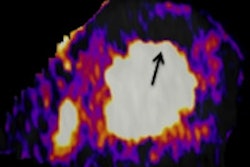
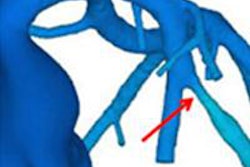
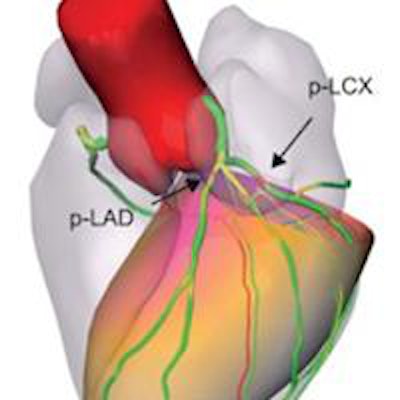
 SMARTVis images of a 61-year-old man. (A) 2D stress polar map fused with projection of coronary tree extracted from CT angiography (CTA). Coronary vessel tree is color-coded with automatically estimated degree of stenosis. (B) Rest polar map fused with projection of coronary tree extracted from CTA. Coronary arteries are coded with distance to epicardium. Patient-specific perfusion territories are also projected. (C and D) 3D model of heart and coronary artery tree extracted from CTA fused with 3D stress polar map. Image courtesy of JNM.
The first clinical benefits of SMARTVis were detailed in a 2012 study by Hortense Kirisli, PhD, from Erasmus Medical Center, and colleagues. The group concluded that the software could be "effectively used to assess disease status in multivessel CAD patients, offering valuable new options for the diagnosis and management of these patients" (International Journal of Computer Assisted Radiology and Surgery, July 2012, Vol. 7:4, pp. 557-571).
The current study by Kirisli and colleagues assessed the diagnostic value of 2D and 3D SMARTVis images created by fusing CT angiography and SPECT myocardial perfusion imaging (MPI) scans. They compared the performance of radiologists interpreting these images with that of radiologists who read studies the conventional way, with CTA and myocardial perfusion images side by side (JNM, January 2014, Vol. 55:1, pp. 50-57).
The researchers enrolled 17 symptomatic patients who underwent both CT angiography and SPECT MPI within a 90-day period. Seven of those subjects also had invasive coronary angiography from which images were available.
SPECT MPI was performed using a two-day protocol starting with the stress acquisition. For CTA, five patients were scanned using a 64-slice CT scanner (Aquilion 64, Toshiba Medical Systems), while the other 12 patients were imaged on a 320-slice CT scanner (Aquilion One, Toshiba).
For the entire study population, there were 68 therapy decisions to be made (four vessels each in 17 patients). The average interobserver therapeutic-decision agreement from the side-by-side analysis was 74%, with four observers agreeing in 41 cases (60%) and one observer disagreeing in 19 cases (28%). No consensus was reached in the remaining eight cases (12%).
For the seven patients who underwent CTA, MPI, and invasive coronary angiography, there were a total of 28 therapeutic decisions. The four readers agreed on the course of therapy for 14 cases (50%) in the side-by-side analysis, while three observers agreed in nine cases (32%). There was no consensus for the five remaining cases.
SMARTVis utilization
SMARTVis was then used to reconstruct images, and an integrated analysis was performed by the four readers at the two Dutch medical centers. Kirisli and colleagues found that when SMARTVis was used, the individual observers' sensitivity and specificity increased.
| Sensitivity, specificity before and after SMARTVis | ||||
| Reader | Before SMARTVis | With SMARTVis | ||
| Sensitivity | Specificity | Sensitivity | Specificity | |
| 1 | 50% | 100% | 70% | 100% |
| 2 | 60% | 94% | 80% | 100% |
| 3 | 80% | 83% | 100% | 94% |
| 4 | 80% | 83% | 90% | 83% |
When SMARTVis was incorporated for the seven patients who received all three modalities, the average agreement between the observers on therapeutic decisions increased from 81% to 91%.
Among the 28 therapeutic decisions, the four observers agreed on 20 treatment decisions (72%) with SMARTVis, compared with 50% without the software. Three readers concurred in six cases (21%), compared with 32% without the software, and the lack of consensus was reduced from five decisions to two (7%).
For all patients, the average interobserver agreement on therapeutic decisions advanced from 74% to 84% with SMARTVis. Of the 68 therapeutic decisions, the four observers agreed in 53 cases (78%), compared with 60% previously, and one observer disagreed in eight cases (12%), compared with 28% previously. No consensus was reached in the remaining seven decisions (10%), down by one from eight cases.
"The results of our case study demonstrated that in several cases the integrated analysis of cardiac CTA and SPECT MPI has a clinical benefit, in the sense that there was both an increase in interobserver agreement and better agreement between therapy planning decisions and the reference standard," the authors wrote.
SMARTVis added value for the diagnosis of patients who had perfusion defects in fewer coronary territories than were suspected to have vessel disease on CTA, they noted.