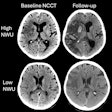
The relative attenuation of cerebral vascular structures in CT helps radiologists diagnose a variety of problems, such as hematoma, thrombosis, and ischemia. For example, hyperdensity in the middle cerebral artery, known as dense MCA sign, can often warn of impending stroke. However, the effect of an individual's blood profile on the resulting attenuation values has not been well studied.
At the 2001 RSNA meeting in Chicago, Dr. Damon DeTeso from the New England Medical Center in Boston discussed his team's study of 28 patients who underwent head CT along with a blood profile. DeTeso and colleagues found that hemoglobin was the most important factor, accounting for fully half of the variation in attenuation values. More research will be needed to account for the remaining variances, the group concluded.
"A commonly held belief is that the density of intracranial vascular structures such as the basal artery ... is related to factors such as hematocrit," DeTeso said. "Other theories include dependencies on the level of hydration of a patient, or other lab values such as serum electrolytes."
And yet there are no published studies that specifically compare the attenuation of intracranial vascular structures to patients' hematological and chemical profiles, he said. The lack of understanding might contribute to diagnostic dilemmas in patients with suspected vascular thrombosis, for example, where such hematological factors can increase attenuation.
The researchers retrospectively evaluated 28 patients who underwent unenhanced CT of the head, as well as a hematologic chemical profile within four hours of CT.
"We felt the short time interval was needed for the most accurate representation of the lab values at the time of imaging," DeTeso said.
Exclusionary factors included excessive motion artifacts, poor visualization of the vascular structures, or excessive calcification of the basal artery, which could give a falsely elevated Hounsfeld unit (HU) value. Patients with significant intercranial abnormalities, such as a large tumor or extensive trauma, were also excluded.
Regions of interest ranging from 2 to 3 mm were placed in the basilar artery (BA), superior sagittal sinus (SSS), tentorium, and brain to determine the attenuation values.
"The lab values that we looked at for each patient were hemoglobin, hematocrit, BUN (blood urea nitrogen), creatinine, sodium, potassium, fluoride, and glucose," he said. "The data for the (BA) and (SSS) densities and the lab values were analyzed using a bivariate Pearson's correlation, and then a stepwise forward regression analysis was used to find the best predictor of CT density."
According to the results, the HU values for the basal artery averaged 32.7 in the SSS, and about 40.7 in the remaining areas. The statistically significant relationships included:
- Density of the BA and hematocrit: r=0.56, p=0.2
- Density of BA and hemoglobin: r=0.68, p<0.01
- Density of the SSS and hematocrit: r=0.66, p<0.01
- Density of the SSS and hemoglobin r=0.71, p<0.1
The group also found significant correlation coefficients for the SSS in hemoglobin, and for the SSS in hematocrit (0.7 and 0.67 respectively, p < 0.01).
Stepwise regression analysis for the BA in hemoglobin showed an R value of 0.70 (P < 0.01) and adjusted R2 of 0.45, "which means that approximately 45% of the variance of attenuation values in the basal artery was explained by hemoglobin," DeTeso said.
Similarly, for the SSS in hemoglobin, the R2 value was 0.50, meaning that about half of the attenuation variance in the SSS was explained by hemoglobin.
"In conclusion, we found that the hemoglobin level was the strongest predictor of the lab parameters that we looked at, even stronger than hematocrit," DeTeso said. "And hemoglobin explains approximately 50% of the variance in attenuation values in these structures. This obviously suggests that other factors are contributing to the remaining variance, so a larger patient population with more extensive chemical and hemotologic evaluation are needed in the future."
While the measured density variations were statistically significant, they were visually subtle, and not easily seen by the naked eye, DeTeso said.
By Eric BarnesAuntMinnie.com staff writer
January 16, 2002
Copyright © 2002 AuntMinnie.com

