The growing field of perfusion CT imaging has great potential to offer diagnostic information that other imaging methods cannot -- in tasks such as distinguishing cancer from vascular malformations, comparing perfusion patterns in two kidneys, or assessing blood flow to different parts of the brain.
There are many ways to acquire the perfusion images, too, all of which involve tradeoffs between dose and image quality, according to radiologist Dr. Patrick Rogalla, formerly of Charité Hospital, Berlin, and currently a professor at the University of Toronto department of medical imaging.
At the 2009 International Symposium on Multidetector-Row CT, Rogalla surveyed perfusion methods and protocols that can be adapted to specific diagnostic requirements and imaging workflow constraints.
"When we talk about time-resolved imaging, what we want to see is the process: motion, flow, blood flow enhancement over time," Rogalla said. "Since CT utilizes x-rays to produce an image, there's a penalty in the radiation dose, and the more we move toward time-resolved imaging, the more radiation we have to accept to generate the images."
And it's more than a two-way tradeoff. There's actually a triangular relationship between pathophysiology, data acquisition, and the analysis technique in perfusion imaging, Rogalla said. As a result, protocols must be adapted to deliver the images that are needed using as low a dose as possible.
Compartmental or deconvolution
The two principal perfusion models in use are compartmental (or Patlak plot) analysis and deconvolution (or maximum slope), which have different requirements and produce different imaging results, he said. Perfusion can be calculated from the maximal slope of the tissue concentration-time curve, or from its peak height normalized to arterial input -- and commercial software offers both options.
Compartmental analysis software is based on a two-compartment model that relies on the backflow of contrast medium from the extravascular to intravascular compartments. The exchange of contrast between blood and tissue is then calculated on the Patlak plot, which uses linear regression to analyze contrast uptake in tissue.
 |
| All images courtesy of Dr. Patrick Rogalla. |
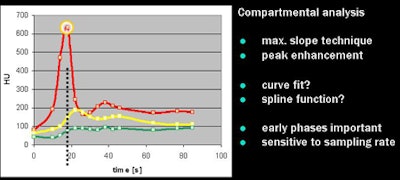
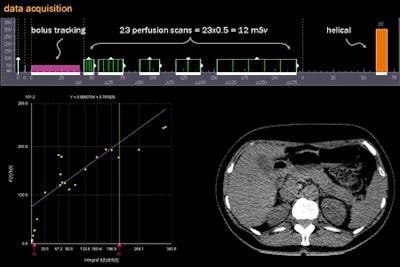
"The beauty of the [Patlak plot] is that it's linear; we can directly read off the intercept of the y-axis and the graph of the blood volume; the slope of the graph represents the perfusion," he said. When calculating protocols "we try to find the maximum slope, the maximum gradient of tissue enhancement, divided by the peak arterial enhancement," Rogalla explained.
In the compartmental model, catching the early imaging phases is key to getting accurate results, Rogalla said. Compartmental analysis is highly sensitive to the sampling rate, and using the scanner's shuttle mode to go back and forth can degrade the results.
"When we draw a line on the coronal reconstruction, we will have at different levels in the image different time points. That leaves us temporal nonuniformity, on top of an already slow sampling rate," he said.
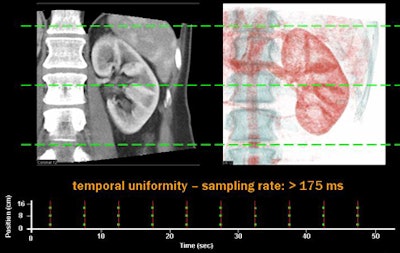
A better way to acquire images is snapshot or "flash" imaging of the entire volume simultaneously at multiple time points, which provides temporal uniformity at any point in the image, and sampling rates as short as 175 msec, Rogalla said. Charité acquires these images on its 320-slice CT scanner (Aquilion One, Toshiba America Medical Systems, Tustin, CA), which provides for multiple acquisitions of large volumes over time.
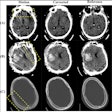
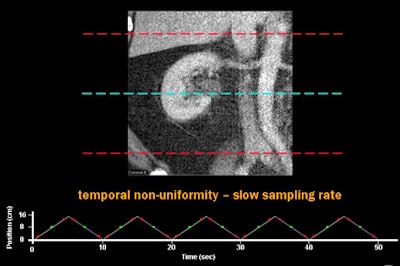 |
| Above, using a CT scanner's shuttle mode to acquire perfusion images can result in temporal nonuniformity and a slow sampling rate. Below, dynamic imaging of the entire volume at multiple time points provides temporal uniformity and sampling rates as short as 175 msec. |
 |
Deconvolution method
Deconvolution algorithms compare the shape and height of the time-attenuation curve of each pixel in a CT time series with the shape and height of the arterial and venous time-attenuation curves to control the contrast bolus administration. Compared to compartmental analysis, the results are more accurate at lower contrast injection rates.
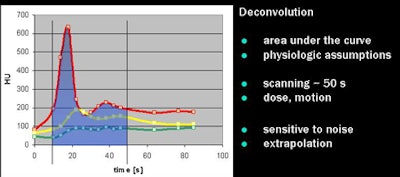 |
"Basically what [the software] is analyzing is the area under the curve, and you also need some other parameters which we have to extrapolate," Rogalla said. While the results are visually appealing, they require an acquisition time of about 50 seconds, and the results are relatively sensitive to noise and extrapolation errors, he said.
Varying perfusion protocols
Multiple protocol design possibilities are used at Rogalla's institution. Commonly, they begin with a bolus tracking sequence to catch the arterial inflow, followed by a certain number of perfusion scans, followed by a diagnostic helical acquisition.
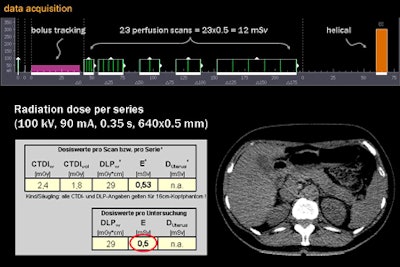 |
| The acquisition shown above includes 23 perfusion scans, each providing a radiation dose of 0.5 mSv, for a total of 12 mSv plus a diagnostic scan at the end. The Patlak plot (below, left) provides a trend line from which perfusion values can be read directly. Reducing the number of perfusion scans is a workable option depending on the organ and diagnostic needs, but it can also reduce the reliability and reproducibility of the results. |
 |
A variation on this method involves the administration of a second, delayed contrast bolus between the perfusion imaging and the diagnostic scan following the perfusion acquisitions, Rogalla said. These results tend to be very sensitive to settings and data noise, and administering the second bolus at the end before the diagnostic scan can mask pathology.
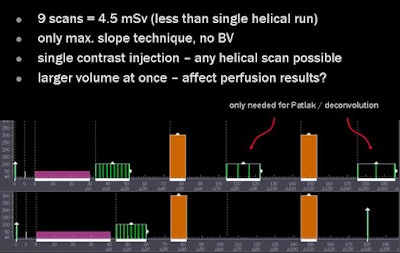 |
| It is possible to administer a single, high-volume contrast injection throughout the volume and place the diagnostic scans in the middle of the acquisition, surrounded by perfusion scans. The effect of the diagnostic scan on perfusion software can vary, but the advantage of this method is that it incorporates the diagnostic acquisition with perfusion imaging in a single scan. |
Another way is to administer contrast in a single, high-flow-rate injection, with the diagnostic scan placed between the perfusion scans. Once again the number of perfusion scans can be reduced to spare radiation dose.
However, this method can make the resulting time-density curves "look a little bit peculiar due to extrapolation [by the software] that causes problems for the absolute values," Rogalla said. It doesn't necessarily inhibit the assessment of perfusion, but it may. "Keep in mind that we only have the later perfusion scans to calculate the Patlak plots," which could affect the results, he said.
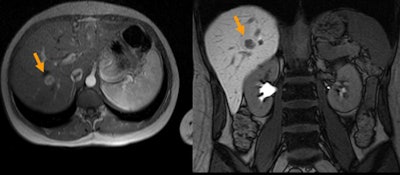 |
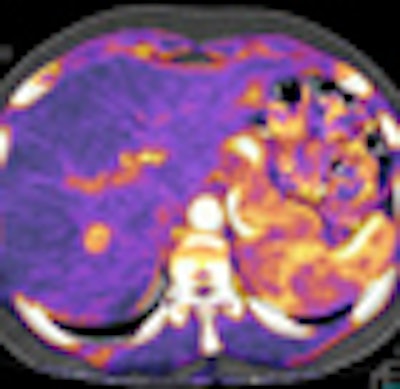
| MRI (above) was equivocal in the diagnosis of a liver lesion. Volume CT perfusion imaging (below) revealed hyperenhancement suggesting focal nodular hyperplasia that was later confirmed by CT-guided biopsy. |
 |
Deconvolution (or maximum slope) and compartmental (or Patlak) are competing methods with different protocol requirements and different effects, Rogalla concluded. "The key issue is the sampling rate, and particularly for maximum slope the shuttle mode might cause a problem. Also in maximum slope we have temporal nonuniformity, which might be an issue in perfusion analysis."
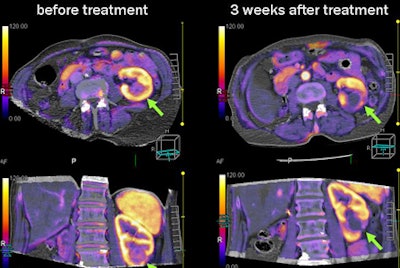 |
| Perfusion imaging was used to monitor the results of percutaneous radiofrequency ablation of a renal cancer. Three weeks post-treatment, 320-detector-row CT perfusion imaging showed no remaining perfusion in the kidney, confirming successful ablation of the tumor. |
The constants between the two main perfusion methods are the more scans acquired, the higher the dose, requiring careful assessment of the protocol, he said.
Nevertheless, varying the sequences is a worthwhile pursuit, "because we would like to integrate perfusion into the clinical protocol," Rogalla said. "The ultimate goal is to have morphology and perfusion within the same CT scan."
By Eric Barnes
AuntMinnie.com staff writer
November 13, 2009
Related Reading
FDA issues radiation alert after CT brain perfusion overexposure, October 8, 2009
How I do it: CT perfusion in functional tumor imaging, August 7, 2009
CT perfusion catches stroke cases that CTA misses, April 30, 2009
Perfusion CT predicts treatment response for pancreatic cancer, January 2, 2009
New neuroimaging potential seen in 320-row CT, October 20, 2008
Copyright © 2009 AuntMinnie.com


