Manual quantification of stenosis suffers from interreader variability, which can affect interpretation and comparison of results. Software-based automated techniques can do a much better and more efficient job, according to a pair of recent studies.
In one study, researchers from the University of Aachen shared how their software tool can reliably and accurately quantify stenosis in CT angiography and MR angiography datasets. Meanwhile, a team from Eberhard Karls University and Siemens Healthcare has found that both experienced and inexperienced readers can achieve reproducible results with computer-assisted quantification of carotid artery stenosis.
The University of Aachen team had initially developed its tool to measure stenosed vessel diameters in mice with a micro-CT scanner in a reader-independent, accurate, and efficient way, lead author Felix Gremse told AuntMinnie.com.
"The dual-energy functionality of our [micro] CT was found useful to automatically discriminate between iodine-enhanced blood and calcifications," he said. "Then we realized that this could have clinical value and evaluated the method on clinical MRI, CT, and dual-energy CT datasets of patients with carotid artery stenosis."
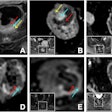
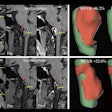
The university's software segments vessel lumen based on user-provided start and end points in the 3D dataset, according to the authors. A virtual elastic sphere is then fitted into the segmented vessel lumen, with the adapting diameter recorded over the course of the vessel (Radiology, July 25, 2011).
The software also estimates blood intensity to perform final segmentation. Stenosis and distal diameters are presented to the reader by showing the corresponding sections and an overlay of a circle that indicates the determined diameter, according to the researchers. With a threshold of 3.6 mm on the distal diameter, the near-occlusion state is also presented to the reader.
Users are required to mouse-click at three points: the start and end points of the vessel and a point in the bulb before the stenosis. The tool is 50% faster than manual, slice-based measurements, Gremse said.
After initial testing on phantoms and mice, the researchers evaluated the software in 16 clinically symptomatic patients with carotid artery stenoses between May 2007 and April 2008. Contrast-enhanced dual-energy CT angiography (Somatom Definition, Siemens) and MR angiography (Achieva 3T, Philips Healthcare) were performed on the two women and 14 men, who had a mean age of 67.2 years.
Working independently and blinded to each other's findings, two radiologists (with three and seven years of vascular imaging experience, respectively) measured stenosis scores based on criteria from the North American Symptomatic Carotid Endarterectomy Trial (NASCET) in the left and right internal carotid arteries manually with a virtual caliper. In later sessions, the radiologists also provided the seed points to apply the automated tool.
After one week, the manual sessions were repeated to test intrareader variability.
Interreader correlation for stenosis measurements
|
The automated tool was also significantly stronger (p < 0.01) in comparison with manual intrareader correlation (CT, r = 0.937; dual-energy CT, r = 0.937; MR, r = 0.915).
In addition, the automated tool was significantly faster (p < 0.01). Reader time dropped from a mean of 104 seconds per carotid artery with manual scoring to 35 seconds per carotid artery with automated scoring.
"Our method reduces interreader variability and improves accuracy and efficiency," Gremse said. "It works for MR and CT angiographies and can make use of dual-energy CT, if available."
The tool's efficiency allows for its use in clinical routine, according to Gremse.
"Measurements become reader-independent and, therefore, more comparable between institutes and between clinical routine and study results," he told AuntMinnie.com.
Gremse said the tool is being used for research activities within the University of Aachen, such as at the Institutes for Molecular Vascular Research, Radiology, and Vascular Surgery. A prototype has also been integrated into the Imalytics research workstation (Philips Research), and there are plans to make it commercially available for research purposes, he said.
Carotid stenosis
In the second study, published online in the Journal of Digital Imaging, the research team from Eberhard Karls University and Siemens Healthcare found that a computer-assisted technique can yield good reproducibility in both experienced and inexperienced readers for carotid artery stenosis quantification.
"The high grade of automation of the advanced vessel analysis software tested allows both experienced and inexperienced readers to achieve very good results in the quantification of stenotic lesions in carotid arteries," wrote Christina Biermann, of Eberhard Karls University and Siemens, and colleagues.
The study included 40 patients with suspected carotid artery stenosis, and four readers first read the datasets using standard interpretation techniques. Then, after a latency period ranging from one day to one month, they again read the studies -- blinded to other readers' and their own standard interpretation results -- with the use of stenosis quantification provided by vessel analysis software (syngo.via CT Vascular, Siemens) (J Digit Imaging, July 23, 2011).
Readers 1 and 2 were experienced radiologists with more than three years of experience, while readers 3 and 4 were inexperienced. One of the inexperienced readers was a computer scientist experienced in reading head and neck images, while the other was a technician who had extensive general experience but lacked experience in stenosis quantification, according to the authors.
Interreader correlation coefficient
|
All readers achieved good results and high reproducibility, regardless of their experience levels, Biermann and colleagues found.
For significant area stenosis greater than 70%
|
No significant differences from the use of the vessel analysis software were observed for the two experienced readers (1 and 2), compared with standard image interpretation.
"For inexperienced readers (readers 3 and 4), statistical analysis has shown significant improvements of reading quality in comparison to standard image interpretation," the authors wrote. "Reproducibility as well as the validity of inexperienced reader results were as good as the results of experienced readers."


.fFmgij6Hin.png?auto=compress%2Cformat&fit=crop&h=100&q=70&w=100)


.fFmgij6Hin.png?auto=compress%2Cformat&fit=crop&h=167&q=70&w=250)

