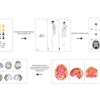
Video demonstrates ECG-gated continuous cyclical measurement during passage of the contrast agent through the heart at coronary CTA. A region of interest in the vessel of interest (aorta, coronary artery) generates the time-density curve.
noneCoronary CTA
Feb 18, 2010
Latest in Home

Bone-RADS improves accuracy for junior, attending physicans
October 17, 2025


PET/CT reveals ‘chemo brain’ regions in leukemia patients
October 16, 2025


