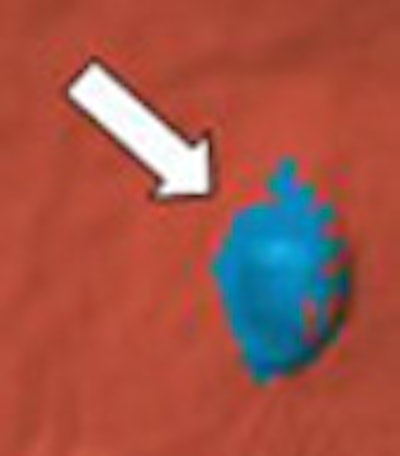
The National Institutes of Health (NIH) scored a CAD coup this month with a study concluding that its VC computer-aided detection (CAD) system yielded sensitivities that were statistically equivalent to that of optical colonoscopy for significant polyps in a large screening population.
The retrospective study, presented by Dr. Ronald Summers at the 2005 RSNA meeting in Chicago, tested the NIH group's in-house virtual colonoscopy (VC) CAD software on CT data from the multicenter U.S. Department of Defense (DOD) trial by Dr. Perry Pickhardt and colleagues on 1,186 average-risk patients (New England Journal of Medicine, December 4, 2003, Vol. 349:23, pp. 2191-2200).
The much-heralded Department of Defense study, which found that radiologists, too, did as well or better than gastroenterologists at detecting clinically significant adenomas, was known to have produced good CT data, which may have helped the results. But the CT data, while generally well distended and free of fecal residue, weren't perfect, according to Summers, who said the bowel-cleansing protocol left significant residual fluid in many of the datasets.
"A number of papers have shown that CAD works well in small trials, but there had not been large trials for CAD," Summers said in his RSNA talk. For this reason the Department of Defense's landmark study offered a chance to further examine data on a large number of patients who underwent oral contrast-enhanced CT colonography (CTC or VC).
The CT data were acquired at three medical centers from 1,186 screening patients, all of whom underwent same-day virtual and optical colonoscopy. The NIH and DOD research team included Jianhua Yao, Ph.D.; Dr. Perry Pickhardt; Marek Franaszek, Ph.D.; Ingmar Bitter, Ph.D.; Daniel Brickman; Vamsi Krishna; and Dr. J. Richard Choi, along with Summers.
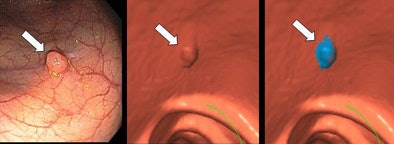 |
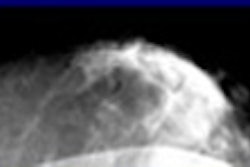
| Optical colonoscopy image of polyp (arrow, left); virtual colonoscopy 3D endoluminal image showing same polyp (arrow, middle); blue CAD mark on VC image of polyp (right). Green line is a segment of the colon centerline used for navigation. All images courtesy of Dr. Ronald Summers. |
"We were concerned about avoiding experimental bias, so we divided the data into separate training and test sets on a 1:2 ratio -- 394 patients in the data training set and 792 in the testing set," Summers said. Separating the training and testing cases meant that the CAD software would be subjected to the more rigorous test of looking for adenomatous polyps in unfamiliar data, a process Summers' group has called essential for the valid analysis of CAD algorithms.
The NIH researchers calculated sensitivities, false-positive rates, and free-response receiver operating characteristic (FROC) curves for adenomatous polyp size thresholds of 8 mm and 10 mm. The study was not designed to look for nonadenomatous polyps, he said.
Patients consumed a clear liquid diet prior to CT scanning, and underwent a 24-hour purgative bowel-cleansing regimen with two 45-mL doses of Phospho-soda (Fleet Pharmaceuticals, Lynchburg, VA) and 10 mg of bisacodyl, along with two 250-mL doses of 2.1% barium contrast material to tag any fecal residue. The patients self-insufflated the colon with room air to tolerance.
CT images were obtained on either a four- or eight-slice multidetector-row scanner using 2.5- or 1.25-mm collimation, respectively. Both prone and supine scans were performed using 15 mm/sec table speed, 1-mm reconstruction intervals, 100 mAs, and 120 kVp.
The CAD software performed a multistage analysis of the CT data consisting of colon segmentation, electronic fluid subtraction, and discriminant shape and curvature analysis. The next step was 3D segmentation of polyp candidates for the classification of true polyps from false positives, Summers said.
"The primary end points were sensitivity per adenomatous polyp and per patient, and false positives per adenomatous polyp and per patient," he said. "The bottom line is that for polyps 10 mm and larger there was no statistically significant difference between CAD in combination with VC and optical colonoscopy prior to segmental unblinding. However, for polyps 8 mm and larger, optical colonoscopy did have superior performance."
Specifically, for the 394 training cases, CAD's per-polyp and per-patient sensitivities were 86.2% (25/29, 95% CI [68.3%, 96.1%]) and 89.3% (25/28 [71.8%, 97.7%]), respectively, for detecting adenomatous polyps 1 cm and larger.
CAD's per-patient sensitivity for adenomas 8 mm or larger in the test set, 85.4% (41/48 [72.2%, 93.9%]), was comparable to that of optical colonoscopy prior to segmental unblinding, 89.6% (43/48 [77.3, 96.5]).
CAD yielded 2.1 [2.0, 2.2] false positives per patient for adenomatous polyps 10 mm and larger, and 6.7 [6.5, 6.9] false positives for polyps 8 mm and larger.
The false-positive rate was 2.1 [2.0, 2.2] false polyps per patient. Both carcinomas were detected by CAD at a false-positive rate of 0.7 per patient; only one of two was detected by optical colonoscopy prior to segmental unblinding. The per-patient sensitivity of CAD for adenomas 8 mm or larger in the test set, 85.4% (41/48 [72.2%, 93.9%]), was comparable to that of optical colonoscopy prior to segmental unblinding, 89.6% (43/48 [77.3, 96.5]).
For adenomas 8 mm or larger, the false-positive rate was 6.7 [6.5, 6.9] false polyps per patient. The most common causes of CAD false positives were ileocecal valves (52/64, 81%) and colonic folds.
Bootstrap analysis showed that most false negatives were found on the air-fluid boundary or on adjacent to normal haustral folds, he said, and the group also looked at CAD's false-positive findings, Summers said.
"We went back to the original study with the radiologists and we saw how many false positives were in common (with CAD results)" he said. Since only 15 of 1,692 false positives coincided with false-positive findings of the radiologists, the group concluded that nearly all CAD-generated false positives would be easy for radiologists to dismiss.
FROC analysis showed that sensitivities were slightly higher (< 5%) on the training set compared to the test set for both the 8- and 10-mm size thresholds.
"In our study we found that our CAD system had high performance that was comparable to that of optical colonoscopy," he said. "For polyps 1 cm or larger on a per-patient basis, performance was comparable to optical colonoscopy.... The results were generalizable, meaning that when new data was presented to system, the system worked nearly as well" as on the CAD training datasets.
A full version of the study has just been published in Gastroenterology (December 2005, Vol. 129:6, pp. 1832-1844). In that paper the authors wrote: "For guiding practical use by clinicians and future technical improvements, it is important to ascertain particular situations in which CAD is less effective. The sensitivity of our CAD system was lower for polyps under fluid, for small sessile and flat polyps, and for small polyps on folds."
By Eric Barnes
AuntMinnie.com staff writer
December 21, 2005
Related Reading
New VC reading schemes could solve old problems, October 13, 2005
'Filet view' VC software slices reading time, October 6, 2005
VC path-planning technique maximizes observable mucosa, August 30, 2005
Colon CAD: VC's extra eyes face new challenges, August 5, 2005
Part II: Computer-aided detection identifying new targets, July 15, 2005
Copyright © 2005 AuntMinnie.com


