Each year more CT lung scans of smokers and former smokers are acquired, and more lung cancers are caught when potentially curable. Supporting a growing number of lung screening programs are computer-aided detection (CAD) applications, which continue to grow in sophistication and accuracy.
Much of the research is still aimed at evaluating the most basic CT features of solitary pulmonary nodules -- size, density, and shape. The accuracy of CAD results can rarely be measured directly, as it is neither wise nor practical to resect or biopsy most solitary pulmonary nodules. The lack of a gold standard has led to the creative use of surrogates such as phantoms and projected lesions in many studies.
The uncertainty surrounding CAD results also complicates another important research goal -- that of tracking and classifying nodule size over time. On one hand, sensitivity must be high and volumetry precise before a risky decision is made to intervene. On the other, delaying treatment has its own costs, and an ever-growing volume of screening-detected nodules makes automated tracking a necessity rather than a luxury.
Nodule detection and volumetry were explored in a number of studies presented at the recent 2006 European Congress of Radiology (ECR) in Vienna, on which this two-part series on CT lung nodule assessment is based.
In one study, Korean researchers modified their thin-section reconstruction protocols to quantify differences in nodule measurements. In another, a team from Munich, Germany, compared manual to automated lung nodule measurements in the assessment of treatment response based on nodule size. And investigators from France and the U.S. examined the effect of lossy compression on nodule detection and volumetry, only to find that both remained robust despite increasingly blurred CT data.
Varying image plane along the z-axis
Dr. Jin Goo and colleagues from the radiology department of Seoul National University in Korea sought to assess variation in nodule volumetry based on image plane.
They examined 121 noncalcified pulmonary nodules 30 mm and smaller from 44 consecutive patients, acquired using 16-detector-row CT at 16 x 0.75-mm collimation. The next step was reconstruction of overlapping images from two section thicknesses (1 and 3 mm) at 0.2-mm reconstruction intervals. From these highly overlappping datasets, the group sampled and prepared multiple contiguous nonoverlapping image sets by shifting the z-position of the images.
"We speculated that in some cases the partial volume effect could be minimized on images with starting points of 0 mm, but in other cases the partial volume effect can be minimized on images with starting points of 0.6 or 1.6 mm," Goo wrote in an e-mail to AuntMinnie.com.
"The difference in partial volume effect by shifting the z position may be greater for thicker image reconstructions," Goo said in his ECR presentation.
All images were reconstructed and interpreted using a Vitrea 2 workstation (Vital Images, Minneapolis, MN). Automatic segmentation was performed by clicking on the nodules, and no manual adjustments were used, he said. Paired t-tests were performed to compare the measurement differences between two reconstruction methods.
"In the 1-mm section thickness images, measurements with the starting points of 0 and 0.6 mm were compared. In 3-mm section thickness images, measurements with the starting points of 0 and 1.6 mm were compared," Goo wrote. "Because this analysis may not be enough to see the effect of different imaging planes, we added comparisons between the minimum and maximum of the two measurements to evaluate the maximum effect of imaging plane for each section thickness."
Successful segmentation was performed in 82 pairs using 1-mm section thickness and 71 pairs using 3-mm section thickness datasets. Nodule volume from highly overlapped data ranged from 11 to 11,000 mm3, which is equivalent to 2.7 to 28.3 mm in effective diameter. The results showed no significant difference in nodule size between the two reconstruction methods (p > 0.05).
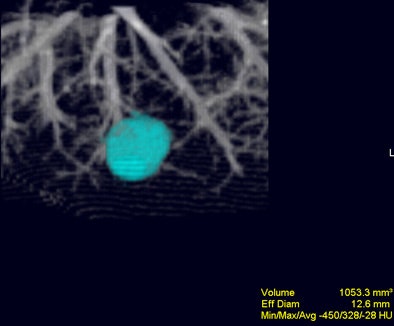 |
| Volume-rendered image obtained with Vitrea 2 program shows a segmented nodule with volumetric measurement results. Image courtesy of Dr. Jin Goo. |
"However, the comparison between minimal and maximal measurements showed significant differences," he said. Differences were seen in both 1-mm (all, p = 0.03; < 10 mm, p < 0.01; 10-20 mm, p = 0.04; > 20 mm, p = 0.25) and 3-mm (all, p < 0.01; < 10 mm, p < 0.01; 10-20 mm, p = 0.04; > 20 mm, p = 0.40) section thicknesses.
So while measuring with two different section thicknesses didn't reveal significant differences, section thickness was a significant factor in measuring small lung nodules, especially those 2 mm and smaller in diameter, he said.
"In my opinion, measurement variability especially in small nodules is inevitable," he explained. "Therefore, we should understand this variability and error range of measurements. Images obtained with thinner section thickness, smaller FOV (field-of-view), and smaller reconstruction intervals at the same respiratory levels in isolated lung nodules may guarantee less variability between measurements. For computer-aided volumetry for lung nodules to be applied in daily routine, I believe this program should provide not only measurement values but also possible error range in measurement according to the nodule's size and technical factors."
Automated measurement best for treatment response
Another study, from the Technical University Munich in Germany, compared manual measurements to automated CT volumetry to gauge treatment response in patients with pulmonary metastases.
Dr. Katharine Marten and colleagues compared the relative values of manual unidimensional measurements with automated volumetric measurements before and after treatment.
"We prospectively enrolled 50 consecutive patients with primary metastases who underwent two consecutive CT scans for assessment of tumor response using RECIST (Response Evaluation Criteria in Solid Tumors) criteria," she said in her ECR presentation. The mean follow-up time for the repeat post-treatment scan was two months.
All images were acquired on a 16-slice scanner, and were reviewed twice by two independent radiologists who used both manual and automated volumetry measurements (LungCare, Siemens Medical Solutions, Erlangen, Germany). Treatment response categories were assessed on the basis of relative measurement error (RME), inter- and intraobserver correlations, and limits of agreement.
The results showed that "inter- and intraobserver variation, as well as the inter- and intraobserver relative measurement error, (were) significantly higher using manual measurements than automated volumetry" (intraobserver RME = 2.34-3.73% for manual measurements and 0.15-0.22% for automated volumetry, p < 0.05; interobserver RME = 3.53-3.76% for manual measurement and 0.22-0.29% for automated volumetry, p < 0.05), according to Marten.
"The overall intra- and interobserver correlation was excellent using both manual and automated measurements, but was still significantly better for automated volumetry than for manual measurements," she said.
The intraobserver 95% limits of agreement were -1.85 to 1.75 mm for manual measurement and -11.28 to 9.84 mm3 for automated volumetry. The interobserver 95% limits of agreement were -1.46 to 1.92 mm for manual measurements and -11.17 to 9.33 mm3 for automated volumetry. Total intra-/interobserver agreement on response using automated volumetry for manual intra- and interobserver agreements were 0.73-0.84 and 0.77-0.80, respectively (k = 1).
Of the 200 manual measurement response ratings, responses in 14 of 50 were discordant. "There was discordance of manual measurements to automated volumetry in 28 of 200 ratings, and this affected 14 of 50 patients. And there were 10 relative overreads and 18 relative underreads," Marten said. "Discordant response classifications occurred most commonly in patients with progressive disease (p < 0.05) as you can see from continuously decreasing k values (p < 0.05)."
"Automated volumetry is clearly superior to manual measurements, and allows for a higher reproducible response evaluation based on RECIST criteria," Marten concluded. The study was subsequently published in European Radiology (April 2006, Vol. 16:4, pp. 781-90).
CAD sensitivity shrugs off lossy compression
Two other studies presented at ECR examined the effects of lossy image compression on sensitivity. The detection rate and volumetry were largely unaffected by compression algorithms, although some highly compressed images seemed unsuitable for other diagnostic purposes.
"The objective of our study was to find out how we can improve the integration of CAD into PACS and teleradiology applications," said lead investigator Philippe Raffy, Ph.D., from R2 Technology in Sunnyvale, CA. "With the amount of thin-section datasets rising, a solution is required to avoid overloading PACS networks ... and one way to go is to use lossy compression."
Previous studies were mostly reader studies that relied on 2D compression algorithms, and the results generally showed that diagnostic accuracy was preserved up to a compression ratio of 10:1. However, Raffy said, little is known about the effects of 3D data compression on detection performance of a CAD system.
The CAD evaluations were performed on the R2 ImageChecker system with data from 120 studies acquired from five sites.
MDCT images were acquired at 1- and 1.25-mm collimation on a 16-slice scanner with 100-140 kVp, 10-175 mAs, and collimation of 1-1.25 mm. Fifty-five percent (n = 66) were examined with a low-dose protocol, and 91% (n = 109) were interpreted using highly overlapping reconstructions. Of the 120 cases, 83 contained nodules (mean size 5.8 mm), 169 of which were actionable, Raffy said.
All cases were compressed at 24:1, 48:1, and 96:1 compression ratios, using a 3D wavelet compression method known as the SPIHT algorithm, and read on the ImageChecker CAD system. The effects of compression on CAD sensitivity were studied for effects of compression level, nodule size, and scanner characteristics.
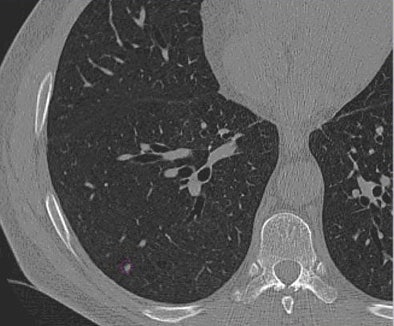
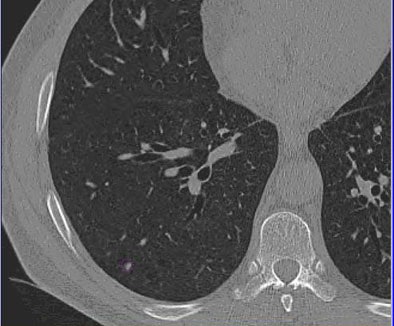
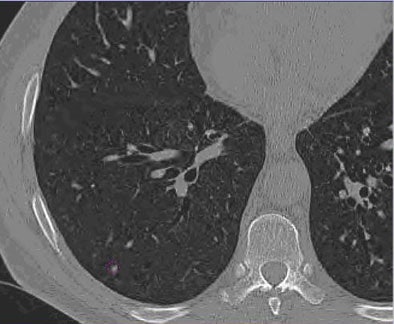
The images were progressively denoised and blurred as the compression ratio increased, and features such as the lung fissure were progressively harder to see. Yet the results showed no statistically significant degradation in sensitivity at any of the compression levels and operating points, Raffy said. Between compression levels there was a marginal association between sensitivity. The 24:1 compression level was significantly better than the 96:1 level at all operating points, and even better than the uncompressed data at 10 false positives per case, he said.
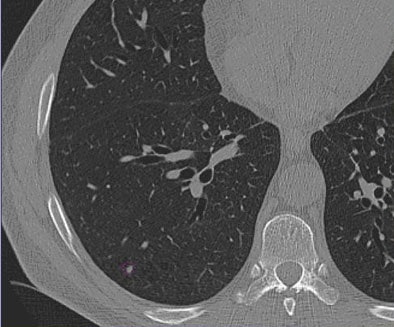 |
| Images of solid lung nodules include uncompressed CT data (above), 24:1 compression (below), 48:1 compression (next down), and 96:1 compression (bottom). CAD detection performance of solid lung nodules greater than 4 mm in size did not suffer until 48:1 compression, and was found to be robust up to 96:1 even when the subjective visual appearance of the compressed images was degraded. The results suggest that 3D lossy wavelet compression can be performed without significant loss of CAD detection performance, which can minimize data storage and ultimately facilitate the implementation of CAD technology in a PACS environment. Images courtesy of Philippe Raffy, Ph.D. |
 |
 |
 |
"Multivariate analysis revealed that nodule location was a significant predictor, with lower sensitivity associated with pleural nodules," Raffy said. "However, compression had no effect on nodule size, (nor did) dose, reconstruction filter, or IV contrast."
It may be the denoising resulting from compression that produced better sensitivity for 24:1 compression than the original data, he said, as noise is known to lower sensitivity in CAD.
"CAD detection and performance was found to be robust at 48:1 compression ratio, with no significant detection degradation up until 96:1," he said. "The use of 3D lossy compression could reduce the burden on PACS systems, he said. However, this would require a shift in current practice."
In a second study, Raffy et al projected phantom nodules of known size into the CT lung data of two patients. The study examined the effect of the same image compression algorithm on the patients' nodules, with the phantom nodules serving as the size reference standard.
These results showed that like sensitivity, compression did not significantly increase the size of volumetry errors. The mean nodule volume measurement error was +3.4% ± 7.6% SD in uncompressed data compared to +0.5% ± 9.1% SD at the 96:1 compression ratio. Progressive increases in compression did not predict the size of the volumetric errors, though the highest compression level, 96:1, did yield statistically significantly smaller nodules on average, with an average volume loss of 4.1 mm3, he said. The volumetry errors were larger on juxtavascular and subpleural nodules, and volume-averaged nodules are most prone to distortion in compression, he added.
Raffy cautioned that the results of the two studies do not mean that highly compressed data is sufficient for the overall evaluation of lung data in clinical practice. Relying on it could in fact be "dangerous," he said, and more studies will be needed to determine acceptable compression levels for specific applications. In any case, data compression for storage purposes should be performed on the entire dataset, not on reconstructions, he said.
By Eric Barnes
AuntMinnie.com staff writer
April 17, 2006
Related Reading
Trimming CT dose decreases lung CAD performance, January 12, 2006
ELCAP data suggest need to work up secondary lung lesions, January 9, 2006
Familial links may improve patient selection for lung cancer screening, January 2, 2006
Lung CAD shows limited sensitivity gains, finds nodules radiologists missed, December 13, 2005
Management strategies evolve as CT finds more lung nodules, August 19, 2005
CAD hunts down missed lung lesions, September 15, 2005
Copyright © 2006 AuntMinnie.com


