Automated CT-based AI tools can visualize biomarkers of body composition changes in patients using Ozempic (semaglutide) for diabetes type 2 treatment or obesity, according to a study published September 10 in the American Journal of Roentgenology.
These changes are beyond what can be evaluated by clinical measures such as weight and waist circumference, wrote a team led by Leslie W. Nelson, DO, of the University of Wisconsin in Madison.
"[We found that] patients with weight loss after semaglutide initiation exhibited overall favorable shifts in body composition measures related to cardiometabolic risk," the group noted.
Semaglutide (a glucagon-like peptide-1 [GLP-1] agonist) is used to treat type 2 diabetes or obesity in adults, and previous research has shown associations between semaglutide and weight loss, diabetes control, and reduced cardiovascular risk, the group explained. But how this treatment exactly affects body composition needs more research. The team conducted a study that used an automated set of CT-based AI tools to assess any changes in body composition after patients began semaglutide therapy.
The study included 241 adult patients in treatment with semaglutide who underwent abdominopelvic CT both within five years before and within five years after beginning that treatment between January 2016 and November 2023. The researchers applied a suite of CT-based AI body composition tools to both pre-semaglutide and post-semaglutide scans and quantified visceral adipose tissue (VAT) and subcutaneous adipose tissue (SAT) area, skeletal muscle area and attenuation, intermuscular adipose tissue area, liver volume and attenuation, and trabecular bone mineral density. They compared results between patients with equal to or more than 5 kg weight loss to those with equal to or more than 5 kg weight gain between scans.
The team found the following:
| CT visualization of effect of semaglutide treatment | ||
|---|---|---|
| Measure | Pre-semaglutide | Post-semaglutide |
| Weight loss group (n = 67) | ||
| Visceral adipose tissue area | 341.1 cm2 | 309.4 cm2 |
| Subcutaneous adipose tissue area | 410.7 cm2 | 371.4 cm2 |
| Liver volume | 2,578 HU |
2,379 HU |
| Liver attenuation | 67.6 HU | 74.5 HU |
| Weight gain group (n = 48) | ||
| Visceral adipose tissue area | 309.4 cm2 | 334 cm2 |
| Subcutaneous adipose tissue area | 485.8 cm2 | 488.8 cm2 |
| Intermuscular adipose tissue area | 37.6 cm2 | 48.4 cm2 |
| Muscle attenuation | 13.1 HU | 5.9 HU |
"Muscle attenuation showed significant decreases in the intermediate-weight-change and weight-grain groups," the authors wrote. "Such a decrease may indicate diminished muscle quality, presumably related to accumulation of intramuscular fat (i.e., myosteatosis). The decrease in muscle attenuation was particularly pronounced in the weight-gain group, consistent with the significant increase in the [intermuscular adipose tissue] area in this group. Given the associations of myosteatosis with frailty and mortality risk, patients with a decrease in muscle attenuation may warrant a recommendation for lifestyle modification such as resistance training."
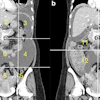
 30-year-old woman with semaglutide use. Patient had stopped semaglutide use 36 days prior to post-semaglutide scan. Patient's weight was 148 kg on pre-semaglutide scan and 176 kg on post-semaglutide scan. Patient was thus assigned to weight-gain group. (A) Coronal maximum-intensity projection (MIP) image from pre-semaglutide scan shows organ segmentations. (B) Axial image from pre-semaglutide scan at L3 level shows color-coded tissue segmentations. (C) Coronal MIP image from post-semaglutide scan shows organ segmentations. (D) Axial image from post-semaglutide scan at L3 level shows color-coded tissue segmentations. Segmented visceral adipose tissue (VAT) is colored yellow, subcutaneous adipose tissue (SAT) is colored blue, skeletal muscle is colored red, liver is colored red, and spleen (not evaluated in present investigation) is colored orange. On pre- and post-semaglutide scans, VAT area was 358.5 cm2 and 412.1 cm2, muscle area was 186.8 cm2 and 225.2 cm2, muscle attenuation was -5.2 HU and -11.0 HU, liver volume was 2,579 and 3,851 mL, and liver attenuation was 77.8 HU and 59.2 HU, respectively. Images and caption courtesy of the AJR.
The study findings add to current research regarding Ozempic's efficacy, according to Nelson's team.
"By applying deep-learning tools to clinically indicated examinations, CT-based body composition assessment may provide biomarkers of cardiometabolic disease, frailty, and mortality risk in patients using GLP-1 agonists, beyond that which is evident by standard anthropometric or clinical measures," it concluded.
The complete study can be found here.