

Contrast agent developer Bracco is preparing for a commercial launch of its version of gadopiclenol, the new MRI gadolinium-based contrast agent (GBCA) that has received approval in the U.S. Bracco will sell the agent as Vueway.
Bracco announced on September 21 that the U.S. Food and Drug Administration had approved gadopiclenol. Bracco developed gadopiclenol in collaboration with Guerbet, which announced the approval on the same day. Guerbet is selling the agent as Elucirem.
Gadopiclenol is designed to address persistent concerns about gadolinium in patients by enabling clinicians to use half the dose required for other MRI contrast agents. Bracco said that Vueway is a highly stable, macrocyclic GBCA that has higher relaxivity compared with other commercially available MRI contrast agents on the market.
Vueway is approved for use with MRI scans of adults and pediatric patients ages 2 years and older to detect and visualize lesions in the central nervous system, such as the brain, spine, and associated tissues, as well as the body, such as the head and neck, thorax, abdomen, pelvis, and musculoskeletal system.
Bracco noted that the approved dose of Vueway is 0.05 mmol/kg, a level that was demonstrated could improve the detection and visualization of lesions over unenhanced MRI alone. The 0.05-mmol/kg dose level also provided similar diagnostic efficacy compared with 0.1 mmol/kg of gadobutrol, a contrast agent with lower relaxivity.
Bracco and Guerbet developed gadopiclenol under a collaboration agreement signed in December 2021. Both companies have the right to market the contrast agent under their own trade names.

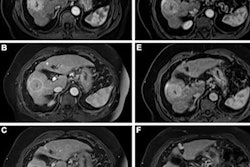
![Overview of the study design. (A) The fully automated deep learning framework was developed to estimate body composition (BC) (defined as subcutaneous adipose tissue [SAT] in liters; visceral adipose tissue [VAT] in liters; skeletal muscle [SM] in liters; SM fat fraction [SMFF] as a percentage; and intramuscular adipose tissue [IMAT] in deciliters) from MRI. The fully automated framework comprised one model (model 1) to quantify different BC measures (SAT, VAT, SM, SMFF, and IMAT) as three-dimensional (3D) measures from whole-body MRI scans. The second model (model 2) was trained to identify standardized anatomic landmarks along the craniocaudal body axis (z coordinate field), which allowed for subdividing the whole-body measures into different subregions typically examined on clinical routine MRI scans (chest, abdomen, and pelvis). (B) BC was quantified from whole-body MRI in over 66,000 individuals from two large population-based cohort studies, the UK Biobank (UKB) (36,317 individuals) and the German National Cohort (NAKO) (30,291 individuals). Bar graphs show age distribution by sex and cohort. BMI = body mass index. (C) After the performance assessment of the fully automated framework, the change in BC measures, distributions, and profiles across age decades were investigated. Age-, sex-, and height-adjusted body composition reference curves were calculated and made publicly available in a web-based z-score calculator (https://circ-ml.github.io).](https://img.auntminnie.com/mindful/smg/workspaces/default/uploads/2026/05/body-comp.XgAjTfPj1W.jpg?auto=format%2Ccompress&fit=crop&h=100&q=70&w=100)


![Overview of the study design. (A) The fully automated deep learning framework was developed to estimate body composition (BC) (defined as subcutaneous adipose tissue [SAT] in liters; visceral adipose tissue [VAT] in liters; skeletal muscle [SM] in liters; SM fat fraction [SMFF] as a percentage; and intramuscular adipose tissue [IMAT] in deciliters) from MRI. The fully automated framework comprised one model (model 1) to quantify different BC measures (SAT, VAT, SM, SMFF, and IMAT) as three-dimensional (3D) measures from whole-body MRI scans. The second model (model 2) was trained to identify standardized anatomic landmarks along the craniocaudal body axis (z coordinate field), which allowed for subdividing the whole-body measures into different subregions typically examined on clinical routine MRI scans (chest, abdomen, and pelvis). (B) BC was quantified from whole-body MRI in over 66,000 individuals from two large population-based cohort studies, the UK Biobank (UKB) (36,317 individuals) and the German National Cohort (NAKO) (30,291 individuals). Bar graphs show age distribution by sex and cohort. BMI = body mass index. (C) After the performance assessment of the fully automated framework, the change in BC measures, distributions, and profiles across age decades were investigated. Age-, sex-, and height-adjusted body composition reference curves were calculated and made publicly available in a web-based z-score calculator (https://circ-ml.github.io).](https://img.auntminnie.com/mindful/smg/workspaces/default/uploads/2026/05/body-comp.XgAjTfPj1W.jpg?auto=format%2Ccompress&dpr=2&fit=crop&h=167&q=70&w=250)


