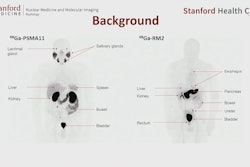
MRI performs comparably to gallium-68 (Ga-68) PSMA PET/CT for prostate cancer diagnosis and treatment tracking, according to research delivered at the recent RSNA meeting.
"Ga-68 PSMA PET/CT and prostate MRI may be complementary in both initial diagnosis and therapy planning, including guiding radiation where it may be the appropriate therapeutic approach," presenter Sean Gharai, MD, of George Washington University in Washington, DC, and colleagues noted. Gharai shared the research on November 26.
Ga-68 PSMA PET/CT imaging has been used mainly to assess prostate cancer's response to initial treatment with surgery or radiation therapy, according to Gharai. However, there are few studies that have compared the use of Ga-68 PSMA PET/CT and prostate MRI in patients newly diagnosed with prostate cancer, and the team investigated whether the two modalities could play a complementary role in this patient population.
The study included 15 newly diagnosed biopsy-proven prostate cancer patients who underwent prostate MR imaging with and without contrast and a Ga-68 PSMA PET/CT exam. The team calculated maximum standardized uptake values (SUVmax) using each patient's body weight and injected dose amount; the team then compared the lesion's PIRADS score with Ga-68 PSMA lesion location and SUVmax.
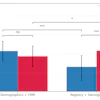
Of the 15 study participants, one was diagnosed with a PIRADS 3 lesion (the presence of clinically significant cancer is unclear); six with PIRADS 4 lesions (clinically significant cancer is likely to be present), and eight with PIRADS 5 lesions (clinically significant cancer is highly likely to be present).
SUVmax values ranged from 3.3 to 29.9, the group reported, and the location of both the Ga-68 PSMA- and mpMRI-identified lesions agreed in 14 of 15 patients. Of these 14, 12 (86%) had a high lesion SUVmax (6.2 to 29.9) and a high PIRADS score (4 or 5). Of the remaining two patients, one had a low SUVmax (3.3) and low PIRADS score (3) and only one had a discordant result, with a high SUVmax (22.7) and low PIRADS score (3).
The findings suggest that MRI could help plan treatment in newly diagnosed prostate cancer patients, according to Gharai and colleagues.
"Further studies with higher sample sizes are warranted to establish a statistically significant relationship between the degree of uptake and PIRADS score," they concluded. "Based on our findings, future investigation of the correlation between SUVmax, PIRADS score, and pathologic Gleason score may aid in treatment planning."


![Overview of the study design. (A) The fully automated deep learning framework was developed to estimate body composition (BC) (defined as subcutaneous adipose tissue [SAT] in liters; visceral adipose tissue [VAT] in liters; skeletal muscle [SM] in liters; SM fat fraction [SMFF] as a percentage; and intramuscular adipose tissue [IMAT] in deciliters) from MRI. The fully automated framework comprised one model (model 1) to quantify different BC measures (SAT, VAT, SM, SMFF, and IMAT) as three-dimensional (3D) measures from whole-body MRI scans. The second model (model 2) was trained to identify standardized anatomic landmarks along the craniocaudal body axis (z coordinate field), which allowed for subdividing the whole-body measures into different subregions typically examined on clinical routine MRI scans (chest, abdomen, and pelvis). (B) BC was quantified from whole-body MRI in over 66,000 individuals from two large population-based cohort studies, the UK Biobank (UKB) (36,317 individuals) and the German National Cohort (NAKO) (30,291 individuals). Bar graphs show age distribution by sex and cohort. BMI = body mass index. (C) After the performance assessment of the fully automated framework, the change in BC measures, distributions, and profiles across age decades were investigated. Age-, sex-, and height-adjusted body composition reference curves were calculated and made publicly available in a web-based z-score calculator (https://circ-ml.github.io).](https://img.auntminnie.com/mindful/smg/workspaces/default/uploads/2026/05/body-comp.XgAjTfPj1W.jpg?auto=format%2Ccompress&fit=crop&h=100&q=70&w=100)


![Overview of the study design. (A) The fully automated deep learning framework was developed to estimate body composition (BC) (defined as subcutaneous adipose tissue [SAT] in liters; visceral adipose tissue [VAT] in liters; skeletal muscle [SM] in liters; SM fat fraction [SMFF] as a percentage; and intramuscular adipose tissue [IMAT] in deciliters) from MRI. The fully automated framework comprised one model (model 1) to quantify different BC measures (SAT, VAT, SM, SMFF, and IMAT) as three-dimensional (3D) measures from whole-body MRI scans. The second model (model 2) was trained to identify standardized anatomic landmarks along the craniocaudal body axis (z coordinate field), which allowed for subdividing the whole-body measures into different subregions typically examined on clinical routine MRI scans (chest, abdomen, and pelvis). (B) BC was quantified from whole-body MRI in over 66,000 individuals from two large population-based cohort studies, the UK Biobank (UKB) (36,317 individuals) and the German National Cohort (NAKO) (30,291 individuals). Bar graphs show age distribution by sex and cohort. BMI = body mass index. (C) After the performance assessment of the fully automated framework, the change in BC measures, distributions, and profiles across age decades were investigated. Age-, sex-, and height-adjusted body composition reference curves were calculated and made publicly available in a web-based z-score calculator (https://circ-ml.github.io).](https://img.auntminnie.com/mindful/smg/workspaces/default/uploads/2026/05/body-comp.XgAjTfPj1W.jpg?auto=format%2Ccompress&fit=crop&h=112&q=70&w=112)


