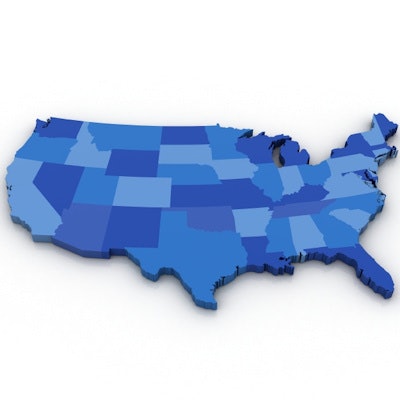
The northeastern U.S. has a higher ratio of radiologists to population than other areas of the country, while the South has the lowest, a geographic variation that could negatively impact patient access to imaging, suggests an August 9 study in the Journal of the American College of Radiology.
A study conducted by a team led by Dr. Aditya Khurana of the Mayo Clinic in Rochester, MN, found a more than fourfold difference in the number of radiologists per 100,000 Medicare beneficiaries in some parts of the U.S. -- a finding that underscores the need to address geographic disparities to imaging access.
"The U.S. population is both aging and growing," the group noted. "As the population in the United States ages, efficiently providing high-quality imaging services ... will increasingly require alignment of the rate of growth of radiologists and Medicare enrollees both nationally and by region and state."
What's causing these variations? One factor could be that lower numbers of medical students are choosing radiology, according to the team: In 2010, 1,084 students matched into diagnostic radiology residencies, while in 2021, only 1,002 did -- a decrease of 7.6%. And fewer radiologists serving more Medicare enrollees could have adverse effects on the quality, access, and cost of imaging services.
For their study, Khurana's team extracted data from Medicare claims submitted by radiologists from the U.S. Centers for Medicare and Medicaid Services (CMS) Physician and Other Supplier Public Use File database between 2012 to 2019. And although the researchers found negligible overall change nationally in rates of growth of the numbers of radiologists and Medicare beneficiaries over the study time frame (79.7 radiologists per 100,000 beneficiaries in 2012 compared to 79.9 in 2019), they did find geographic variations, some of which were dramatic.
For example, the number of radiologists per 100,000 Medicare beneficiaries in 2019 was 38.8 in Wyoming and 161.4 in Minnesota, a 4.2-fold difference.
| Geographic variations in radiologists per Medicare enrollees | ||||
| Number of radiologists per 100,000 Medicare enrollees by geographic area | 2012 | Percent change (compared with national average) | 2019 | Percent change (compared with national average) |
| Nationwide | 79.6 | 0% | 79.9 | 0% |
| Northeast | 98.3 | +23% | 99.3 | +24% |
| West | 88.8 | +11% | 80.2 | +0.3% |
| Midwest | 79.1 | -0.7% | 81.4 | +1.9% |
| South | 66.9 | -16% | 69.8 | -13% |
What can be done to correct these geographic differences? Measures to boost and improve radiologist training might help, as might initiatives to increase the productivity of existing radiological staff (such as employing radiology room assistants, or investing in artificial intelligence technology), according to the team.
"Strategies could include increasing the local pipeline of radiologist training opportunities, attracting additional radiologists to the region with incentives or other efforts to reduce barriers to entry, or increasing the productivity of existing radiologists," the researchers concluded.


