Research into CAD in virtual colonoscopy has moved beyond feasibility, and into the nitty-gritty of functional assessment. Questions about the strengths, weaknesses, and clinical utility of colon CAD schemes dominated discussions of automated polyp detection at the 2002 RSNA meeting in Chicago.
The focus was on the value of CAD schemes in the hands of radiologists, who will ultimately share the job of finding colorectal polyps and cancers with their automated counterparts. Beyond questions of accuracy, robust CAD algorithms are considered crucial in the drive to improve virtual colonoscopy's speed and accuracy to the point where it becomes feasible for high-volume colorectal cancer screening.
Researchers from the National Institutes of Health (NIH) in Bethesda, MD, found that CAD plays a complementary role in finding colonic polyps, often picking up where the radiologist's perceptions leave off. A group from the University of Chicago found that CAD can substantially reduce interpretation time in virtual colonoscopy, yielding high flexibility and low false-positive rates. Another study analyzed the sources of false positives.
Finally, a Mayo Clinic team found that their system detected perceptually challenging lesions with ease, but offered no benefit when the radiologists ignored CAD's advice at the wrong times.
"The potential advantages of CAD include improved performance, possibly on the order of 20%-30%, by helping radiologists identify perceptively challenging lesions, helping reduce interobserver variability, and reducing interpretation time," said Dr. Joel Fletcher, associate professor of radiology at Mayo Medical School in Rochester, MN.
However, he added, CAD plays an adjunctive role with radiologists, who interpret the CT colonography dataset, employ the CAD tool, and evaluate the CAD detections. As a result, "the real value of CAD depends not only on the performance of the CAD tool, but on radiologists' correct or incorrect assessment of CAD findings," he said.
The study sought to evaluate the potential contributions of CAD in a population with difficult-to-detect lesions. Fletcher, along with colleagues Dr. C. Daniel Johnson and Dr. Ron MacCarty, performed the retrospective CAD-based analysis of 19 datasets with many lesions that had been missed in a previous virtual colonoscopy exam but found by conventional colonoscopy.
Dr. Ronald Summers and colleagues at the NIH developed the CAD tool. It is a system that relies on surface shape and CT attenuation to detect colonic polyps in CT data.
The group reviewed 19 cases, 14 of which had polyps. Ten of the 14 cases with polyps were falsely negative in a previous study that compared the results to conventional colonoscopy.
In the study, three radiologists working independently activated the CAD review tool and sought to determine if CAD was highlighting a true-positive lesion. The radiologists each read a portion of the cases, eventually comparing their answers to each other's and to conventional colonoscopy results. A true positive indicated a CAD detection that corresponded to endoscopic findings.
They found 19 true-positive lesions 1 cm or larger in diameter, Fletcher said. The three radiologists detected 6/10, 4/11, and 5/8 of these lesions, respectively. These results were not significantly worse than CAD, which found 9/15 such lesions. At the 5-9 mm size, CAD clearly outperformed the radiologists, detecting 4/9 of such lesions compared with 2/9, 0/2, and 2/7 for the radiologists, respectively.
"But the real question, of course, is did CAD see the additional lesions that were missed by the radiologist? And the answer was yes," Fletcher said. "For the larger polyps, there were three of 15 lesions that were detected by CAD but missed by at least one of the three radiologists. Two (flat) lesions were missed by both radiologists, and one was missed by one radiologist -- and this was a cancer. About 30% (3 of 9 polyps) were missed by both radiologists but detected by CAD."
Thus, CAD increased sensitivity from 12%-20% for the larger lesions, and by 10%-20% for lesions 6-9 mm in size, Fletcher said. However, specificity was reduced inasmuch as CAD yielded an average of 7.3 detections per patient, 6.8 of which were false positives.
This led to a second important question: Did radiologists interpret the CAD findings correctly? Unfortunately, the radiologists failed to identify any of the true-positive CAD findings in either size group. Two 5-9 mm detections were falsely interpreted as representing polyps, compared to endoscopic findings.
"CAD has the potential to improve the detection of colorectal neoplasia in CT colonography," Fletcher concluded. "But radiologists have a difficult time discriminating between true and false positives in CAD, particularly when they have previously overlooked the lesion. They have to realize that if they've already looked at the dataset, the additional polyps that CAD is going to detect might be unusual, and those don't fit their paradigm of normal polyps, like, for example, the flat lesions."
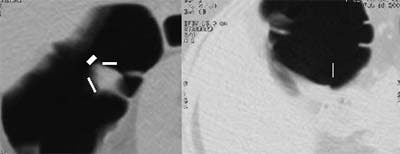 |
| Left to right: prone and supine axial images of a flat tubular adenoma along the fold of the hepatic flexure. The lesion was missed by both radiologists, but detected by CAD (represented by lines in image at left). From Fletcher JG, Summers RM, Johnson CD, MacCarty RL, Wilson LA. Lessons in Detection: Contribution of Computer-aided Detection with Perceptively Challenging Lesions at CT Colonography. Supplement to Radiology November 2002, Vol. 225, p. 304. RSNA December 1-6, 2002, Chicago. Image courtesy of Dr. Joel Fletcher, © Mayo Medical Foundation, 2002. |
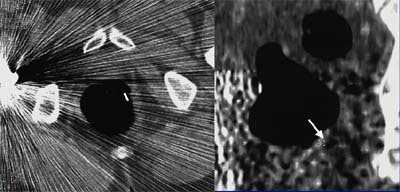 |
| Above, soft-tissue filling defect in the lateral rectum. Straight line in the axial CT image at left represent CAD detection. Arrow in image at right indicates the same defect in the coronal view. From Fletcher JG, Summers RM, Johnson CD, MacCarty RL, Wilson LA. Lessons in Detection: Contribution of Computer-aided Detection with Perceptively Challenging Lesions at CT Colonography. Supplement to Radiology November 2002, Vol. 225, p. 304. RSNA December 1-6, 2002, Chicago. Image courtesy of Dr. Joel Fletcher, © Mayo Medical Foundation, 2002. |
Dialing down the sensitivity of the software to produce fewer detections could potentially improve CAD results, Fletcher said, noting that successful use of CAD also involves a learning curve.
3-D focus may alter CAD's perceptions of pathology
Another study evaluated the same CAD system in a prospective study. Dr. Ronald Summers and colleagues from the NIH examined 40 patients who were asymptomatic but at high risk for colorectal polyps.
"Our CAD algorithm is based on surface shape and CT attenuation measurements," Summers said. "We measure surface shape by calculating the curvature," measuring CT attenuation inside the structure, he said. The results of curvature analysis are yellow for normal curvature, green for haustral folds, and orange for areas around the base of polyps, he said.
In the study, all of the subjects underwent supine and prone virtual colonoscopy on a 4-slice spiral CT scanner using 5-mm collimation and 3-mm reconstructions. The 2-D axial images and 3-D reconstructions were read by two radiologists, and the CAD software was also applied. The results were compared with same-day conventional colonoscopy in each patient.
Conventional colonoscopy found 18 polyps 1 cm and larger, and 12 smaller polyps in 20 subjects. Twenty others had normal results at colonoscopy. At least one radiologist detected 12 of the large polyps and nine of the small polyps, yielding sensitivities of 67% and 75%, respectively. Both radiologists detected six of the large polyps and three of the small polyps.
The CAD software alone found 12 large polyps and six small polyps (sensitivity: 67% and 50%, respectively), including four polyps that were missed by two radiologists, and seven polyps that had been missed by one or both radiologists. Overall, CAD produced a 22% increase in sensitivity, along with an average of 11 false-positive detections per patient, Summers said. CAD plus at least one radiologist found 16 large polyps and 16 small polyps (sensitivity, 89% and 83%, respectively).
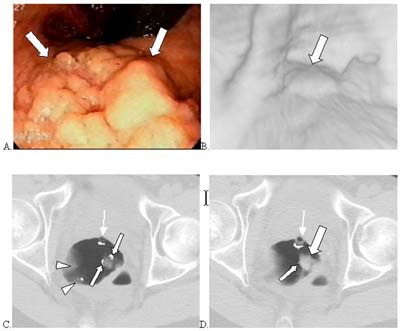 |
| Above, images from a previous patient series. 3.5-cm villous adenoma (large arrows indicate soft tissue mass; small arrows, automated detection mark) in the rectum of 54-year-old male detected by computer program but not by either radiologist. (A) Conventional colonoscopy. (B) Perspective CTC endoluminal view. (C, D) Axial supine CTC images on two adjacent sections. In (D), automated detection mark (small white line on edge of mass) appears small but was larger on adjacent section over top of polyp (C). Tip of rectal tube (thin arrows) and false positives on rectal folds also marked by computer algorithm (small arrowheads). Summers RM, Jerebko A, Franaszek M, Malley JD, Johnson CD. Colonic Polyps: Complementary Role Of Computer-Aided Detection in CT Colonography. Radiology 225: 391-399 (2002). Reproduced by permission of RSNA. |
"The radiologists and the CAD each found about two-thirds of the polyps," Summers said. "But because (each) found polyps missed by the other, the overall sensitivity was higher."
For example, CAD alone found a 2-cm tubular adenoma in the cecum, and an unusually shaped 3.5-cm villous adenoma in the rectum.
"We found that CAD played a complementary role for radiologists' interpretation," he said. "By that I mean that CAD found polyps missed by the radiologists. Conversely, the radiologists found polyps missed by CAD. We're not sure why this is the case, but our hypothesis is that radiologists focus on 2-D images, whereas the CAD software operates on 3-D data."
University of Chicago system scores high marks
Meanwhile researchers from the University of Chicago continue to refine their colon CAD system, which has previously demonstrated high sensitivity for the most common forms of colorectal polyps and cancers.
In the study, 72 patients underwent virtual colonoscopy in both prone and supine positions following standard bowel cleansing and insufflation. Spiral CT data were acquired using collimation of 12 to 2.5 mm, pitch of 1 to 1.7, reconstruction intervals of 1.5 to 2.5 mm, and tube current ranging from 60 to 100 mAs. All of the patients underwent same-day conventional colonoscopy, which was used as the reference standard.
According to the results, 20 polyps were found in 13 patients, four masses were found in four patients, and the remaining 58 patients had normal results. Seventeen of 20 polyps were 5-10 mm in size, three were 11-12 mm in size, and the four masses ranged in size from 25-40 mm. The false-positive rate was 2.45 detections per patient. The CAD scheme yielded 95% sensitivity in a by-polyp analysis, with sensitivity of 100% by patient.
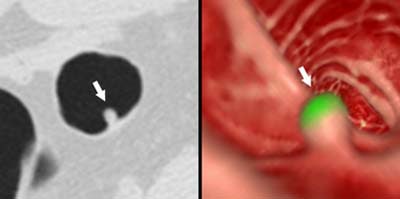 |
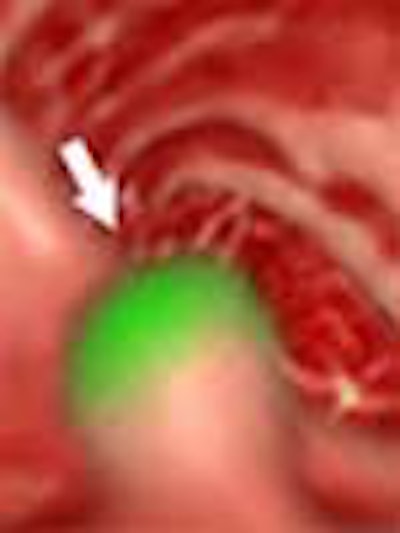
| Above, 8-mm polyp in the sigmoid colon detected by CAD. Left: axial image showing the polyp (arrow). Right: Endoscopic view of the polyp. Green indicates a region identified by CAD as a polyp. Image courtesy of Dr. Hiro Yoshida. |
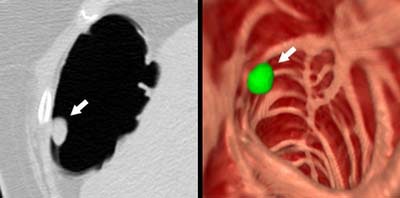 |
| Ten-millimeter polyp in the hepatic flexure detected by CAD. Left: axial image showing the polyp (arrow). Right: Endoscopic view of the polyp. Green indicates a region identified by CAD as a polyp. Image courtesy of Dr. Hiro Yoshida. |
"In summary, the CAD based on geometric and texture features showed a potential to detect polyps with high sensitivity and a low false-positive rate," Yoshida said. "Potential benefits are reduced interpretation time and improved diagnostic performance."
In another presentation analyzing the same 72 cases, Yoshida's colleague at the University of Chicago, Dr. Abraham Dachman, discussed the major sources of false-positive results using the CAD system.
"A low false-positive rate is important to (virtual colonoscopy) because if the false-positive rate is too high, it can increase your interpretation time with the need to problem-solve every false positive," Dachman said. The study sought to determine the major causes of false-positive findings, and assess the potential for improvement.
The team's CAD algorithm, which relies on shape and texture derived from the CT data to detect polyp candidates, includes separate processes of colon segmentation and knowledge-guided segmentation analysis to reduce the number of false-positive results. The polyp-detection algorithm is not designed to detect flat lesions.
Minor flaws in the segmentation software could potentially show up as false positives, Dachman said. The study results were analyzed independently by two radiologists experienced in virtual colonoscopy, who arrived at their decisions by consensus.
In all, CAD produced 90 false-positive results, with an average of 1.3 false positives per patient. (A recent overhaul of the colon-segmentation technique had reduced false positives related to the small bowel and stomach by 40%, Dachman said.)
The two most significant causes of false-positive results were prominent folds or flexural pseudotumor (42%), followed by stool (28%). Small-bowel data was the third most important cause of false positives (9%), followed by stomach data (6%), and motion artifacts and other causes (11%).
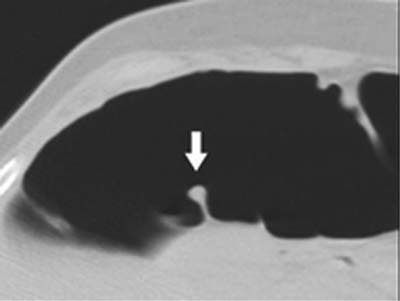 |
| Above, false-positive finding due to a prominent fold. On axial image, the tip of the fold (arrow) appears to be a polyp-like structure, which led to its being incorrectly identified as a polyp. Image courtesy of Dr. Abraham Dachman. |
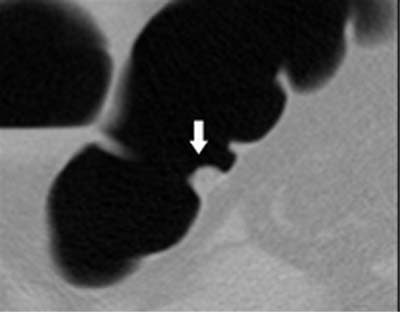 |
| Above, false-positive finding due to retained solid stool. The round appearance and the solid internal structure mimic a polyp. Image courtesy of Dr. Abraham Dachman. |
"All of the false-positives had at least one lesion that had a caplike shape…mimicking the appearance of a polyp," Dachman said, noting that further analysis of the caplike shape algorithm significantly improved the results. In addition, most of the false positives due to stool had solid internal structures, he said.
"Most (87%) of the CAD false positives can be easily identified by the human observer," Dachman concluded. "Reliable identification and removal of folds and stool has the potential to reduce false positives by 70%."
By Eric BarnesAuntMinnie.com staff writer
April 23, 2003
Related Reading
Knowledge-guided segmentation improves polyp detection, October 18, 2002
Virtual colonoscopy: 2-D vs. 3-D primary read, June 3, 2002
Prepless virtual colonoscopy shows early promise, June 3, 2002
New CAD technique improves CT colonography, December 21, 2001
Copyright © 2003 AuntMinnie.com


