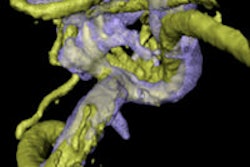
Reducing the tube dose improved the image quality substantially in a CT study of the circle of Willis, according to investigators from the University of Utrecht in the Netherlands.
The results of the study showed that although the signal-to-noise ratio (SNR) decreased when CT angiography was performed at 90 kVp, rather than 120 kVp, SNR increased and image quality rose substantially when the lower kVp was accompanied by an identical mAs setting of 90 -- improving overall image quality by reducing the dose 30%.
The study was conducted with a phantom and in two groups of patients to assess the most effective tube current combination. Drs. Annet Waaijer, Mathias Prokop, Birgitta Velthuis, and colleagues sought to assess the effects of lower tube voltage and various mAs settings in patients undergoing CT angiography (CTA) of the head.
In the phantom arm of the study, circle of Willis SNRs were determined in a head phantom to determine the iodine attenuation curve for various tube currents using tube voltages of 90, 120, and 140 kVp. Later, CT data from two groups of patients who were scheduled for CTA for aneurysm detection were compared to assess image quality at 90 and 120 kVp.
"CT of the circle of Willis is a well-established minimally invasive diagnostic procedure used to detect cerebral aneurysm," wrote Waaijer and her colleagues. "In patients with subarachnoid hemorrhage (SAH), CT angiography can be performed immediately after unenhanced CT to facilitate prompt treatment planning" (Radiology, March 2007, Vol. 242:3, pp. 832-839).
All exams were performed on a 16-detector CT scanner (MX 8000 IDT, Philips Medical Systems, Andover, MA) using 16 x 0.75-mm collimation, rotation time of 0.75 seconds, a B filter, and a 512 x 512 matrix. Reconstruction was performed using 1.0-mm section thicknesses and 0.5-mm reconstruction intervals.
In all, 13 iodine concentrations ranging from 0 to 50 mg of iodine per liter were created to assess the iodine attenuation curve by diluting contrast material (Ultravist, Bayer Schering Pharma, Berlin) with water. Tube voltage settings of 90, 120, and 140 kVp combined with effective mAs were designed to keep the CT dose index (CTDI) volume as close as possible to 27.2 mGy for all three protocols. An observer measured attenuation from regions of interest in the phantom.
In the clinical arm, 20 patients (17 men, 23 women; mean age 61 years ± 12.9) referred for CTA were divided into two groups of 10 each. Group A was scanned at 120 kVp and 200 effective mAs (27.2 mGy). Group B was scanned at 90 kVp and 330 mAs. At a maximum pitch of 1.0, the maximum tube current available on the scanner was only 330 effective mAs, so the resulting CTDI volume was 20.6 mGy, 33% lower than the group A protocol.
The Ultravist contrast material was injected for 17 seconds (50 mL at 5 mL/sec and 20 mL at 3 mL/sec), followed by a 30 mL saline chaser at 3 mL/sec, with a test bolus applied to determine the scan delay for each patient. An experienced observer measured attenuation in the internal carotid artery at the T junction, and in the brain parenchyma at the center of an occipital lobe.
The results showed a linear relationship between iodine concentration and attenuation for all tube voltages. "With an identical effective tube current, SNR² was lower at 90 kVp than at 120 or 140 kVp," they wrote. "With identical CT dose index volume, tube voltage of 90 kVp presented in a 45% to 52% increase of SNR² compared with SNR² at 120 kVp."
In the patient arm, mean attenuation in the internal carotid artery T junction was higher with 90 kVp (340 HU, range, 189-446 HU) than with 120 kVp (253 HU, range, 185-349) HU, p < 0.001).
"These data indicated a 35% increase in arterial attenuation at 90 kVp as compared with arterial attenuation at 120 kVp," the authors wrote. Meanwhile, brain parenchyma attenuation did not differ significantly between 90 kVp (37 HU) and 120 kVp (35 HU).
Moreover, pooled clinical data showed that images acquired at 90 kVp were rated significantly better than those acquired at 120 kVp for arterial enhancement, depiction of small arterial detail, and overall image quality.
"The quality scores increased from 3.2 to 4.0 for arterial enhancement (p < 0.001), and from 3.1 to 3.6 for overall image quality (p < 0.001)," the authors wrote. There was no significant image-quality difference between the protocols for interference of venous structures and image noise.
"While most articles advocate 120 kVp for CT angiography of the brain, we found that enhancement was higher on CT angiograms acquired with 90 kVp," the group wrote, and also that most radiologists rated the image quality higher.
The findings conflict with those of Erti-Wagner et al, who reported superior image quality at 120 kVp. However, these researchers did not adapt the effective tube-current settings when reducing tube voltage, leading to an almost fourfold increase in radiation, and easily explaining the superior image quality at 120 kVp, the authors wrote.
"We recommend low tube voltage scanning with properly adjusted tube current for CT angiography of the circle of Willis in patients with acute SAH or for screening of patients with a family history positive for intracerebral aneurysms," they concluded.
By Eric Barnes
AuntMinnie.com staff writer
March 22, 2007
Related Reading
CT spot sign predicts hematoma expansion in stroke patients, February 26, 2007
Mechanical clot removal can often improve stroke outcomes, February 13, 2007
Advanced MR clarifies nexus between white matter and cerebrovascular disease, February 9, 2007
Relative threshold method correlates CT, MRI stroke infarct assessment, February 9, 2007
Copyright © 2007 AuntMinnie.com


