Dynamic quantitative CT with a 320-detector-row scanner of the subtalar joint offers detailed analysis of joint motion with a tiny radiation dose, revealing strong potential for the assessment of ankle instability, the authors of a new study conclude in the American Journal of Roentgenology.
Researchers examined 15 healthy volunteers without a history of subtalar joint trauma and three cadavers, scanning the subtalar joint during an extended pronosupination cycle and acquiring images in intermittent sequential mode. They measured the angles and distances between the talus and the calcaneus semiautomatically, before and after ligament resection. There was little interobserver variability in the measurements, which revealed joint amplitude increases of about 20% after resection (AJR, November 3, 2016).
"Quantitative dynamic CT of the subtalar joint can provide a detailed analysis of joint motion, supporting its potential role in the evaluation of subtalar instability," wrote the group led by physician assistant Pedro Gondim Teixeira from Centre Hospitalier Universitaire de Nancy in France. "Increases in joint amplitude were identified after sectioning of the subtalar joint ligaments in cadavers, supporting the clinical applicability of this method."
Difficult to diagnose
Chronic ankle instability is a fairly common post-traumatic condition affecting the talocrural and subtalar joints. But the subtalar component of the syndrome is difficult to diagnose owing to its complex anatomy and biomechanics, the authors wrote.
Patients with subtalar joint instability may have pain and disability; however, no specific diagnostic tests are available to diagnose the condition. Most patients are treated conservatively with physiotherapy, muscle strengthening, and immobilization, but there's no objective way to monitor treatment response.
Dynamic CT can be performed at a very low radiation dose, and it has the potential to show fine positional anomalies between bones in vivo. Moreover, semiautomatic measurement tools can increase the reproducibility of subtalar joint amplitude measurements and help establish diagnostic criteria.
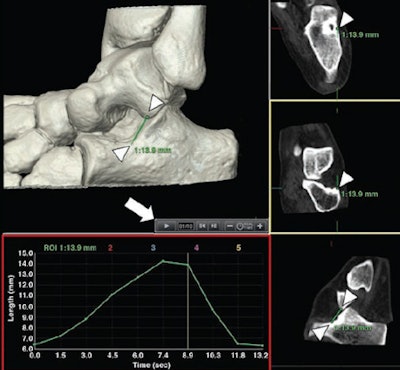 Postprocessing tool user interface. Software allows positioning of various reference markers in any bony structure of study area (arrowheads). Time controls (arrow) allow visualization of all available volumes of dynamic acquisition. Once reference markers for distances (green lines) or angles (not shown) are set, software automatically projects them to all volumes acquired. After analysis, variation of measurement performed in acquisition volumes is displayed graphically (red rectangle). Data can also be exported for further analysis. All images republished with permission from AJR.
"With dynamic CT, the subtalar joint is sampled at various times during a given maneuver," Teixeira and colleagues wrote. "Thus, a large amount of data is available for analysis, and the study of measurement variations during motion, as opposed to comparisons between pre- and poststress acquisitions, is possible. This capability increases the potential to identify fine talocalcaneal positional anomalies."
The 15 volunteers in the study had no history of subtalar joint trauma, nor did the three cadavers evaluated prospectively with dynamic CT to assess the subtalar joint during a pronosupination cycle.
All acquisitions (cadavers and healthy volunteers) were performed using intermittent sequential mode with a 320-detector-row CT scanner (Aquilion One, Toshiba Medical Systems). The anatomy was scanned with a field-of-view of 512 x 512 pixels, 0.5-mm slice thickness, and tube rotation time of 0.35 seconds at 100 kVp and 280 mAs (100 effective mAs).
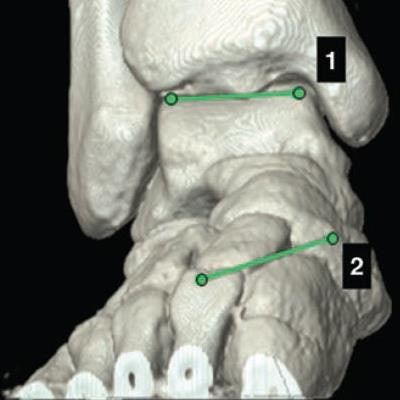
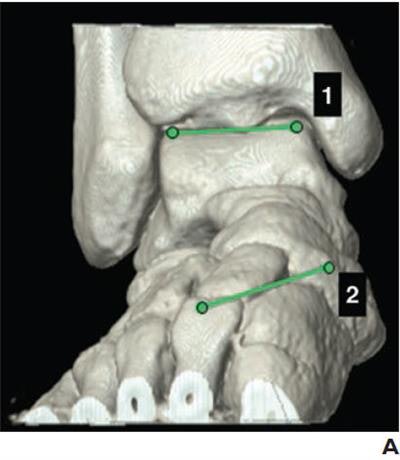 Position of reference markers for two measurements evaluated in 29-year-old female healthy volunteer. All markers were placed on multiplanar reformats on cortical bone. Volume-rendered (A, above) and coronal (B, below) CT images at bimalleolar plane show coronal talocalcaneal angle-measuring procedure. Angle between lines 1 and 2 represents coronal talocalcaneal angle, which was 14.6° in this case.
Image reconstruction was performed using adaptive iterative dose reduction (AIDR) 3D (Toshiba). Radiation doses were higher for the cadavers, as radiation exposure was not a concern. Phantoms were used to estimate CT dose index volume (CTDIvol) and dose-length product (DLP).
The investigators measured the angles and distances between the talus and the calcaneus semiautomatically, describing measurement variation in both the healthy volunteers and cadavers, the latter before and after resection of the cervical and interosseous ligaments. The mean effective dose was less than 0.1 mSv.
All images were reconstructed on a console workstation (Toshiba) using its built-in 4D Ortho clinical application tool. Image analysis and postprocessing were also performed on the workstation. Cadaveric measurements were performed by two experienced radiologists.
The results in cadavers showed mean increases in joint amplitude of 19% after partial ligament sectioning and 22% after full ligament sectioning, the authors wrote. Interobserver variability was excellent for three of the measurement ratios, as indicated by intraclass correlation coefficient, a measure of statistical agreement, with 1.0 representing perfect agreement.
| Interobserver variability by joint on dynamic 4D CT | |
| Intraclass correlation coefficient | |
| Coronal talocalcaneal angle | 0.938 |
| Axial talocalcaneal angle | 0.942 |
| Medial facet gap | 0.865 |
| Posterior calcaneal facet uncovering | 0.569 |
Normal joint motion in the healthy volunteers ranged in amplitude from 6.4% to 22.8%, the researchers found. There was no noticeable variation of measurements between women and men.
In cadavers, variation amplitude and coefficient of variation increased in more than 83% of cases after partial or full ligament sectioning, they noted. Among the various measurements performed, coronal talocalcaneal angle, axial talocalcaneal angle, and medial facet gap were best for showing joint amplitude variation after ligament sectioning. The posterior calcaneal facet uncovering showed contradictory results in the specimens that were examined.
"These changes in subtalar joint motion could be seen without weight bearing, underscoring the performance of dynamic CT and the clinical validity of this method," Teixeira and colleagues wrote.
Using dynamic CT, distances and angles between bones can be evaluated in different ways, they wrote. The variation amplitude and coefficient of variation of measurements were the most useful parameters for assessing the joint motion pattern.
"Normal variation of the four measurements was seen in healthy volunteers, which could be useful for future work on the determination of diagnostic criteria for subtalar joint instability," the authors wrote.
In the cadaver specimens, coronal talocalcaneal angle, axial talocalcaneal angle, and medial facet gap showed increases after partial or full subtalar ligament sectioning varying from 19% to 54%. The medial facet gap was the most promising measurement for assessment, presenting the greatest variation after ligament sectioning in cadavers and smaller variation among healthy volunteers. This was likely due to the anatomic proximity of the medial facets of the subtalar joint and the interosseous ligament.
As for study limitations, the subtalar joint was not evaluated under weight-bearing conditions. The development of a device reproducing weight-bearing CT is underway and expected to improve diagnostic performance.
"Quantitative dynamic CT of the subtalar joint can provide a detailed analysis of joint motion, supporting its potential role in the evaluation of subtalar instability," Teixeira and colleagues concluded. "Increases in joint amplitude were identified after sectioning of the subtalar joint ligaments in cadavers, supporting the clinical applicability of this method."


