This report describes the results of a spatial de-blurring technique based on an iterative inverse filtering procedure, through which the noise effect is expected to remain dissipated while the image structure is refocused to acquire its original sharpness. Thus, overall visual diagnostic resolution of the cross-section is significantly improved.
Introduction
The requirements for filtering MRI images are different from the techniques used to process digital images. While digital images are processed to compensate for image degradation, the purpose of MRI filtering is to reduce the data noise associated with the high frequency terms in the K-space.
The resulting MRI images, however, appear blurred or unfocused. Thus, assuming that image noise is effectively diminished in the filtering process, we propose a de-blurring step based on any good approximation of a localized spatial blurring model.
An ideal determination of the blurring model approximation has to use machine reconstruction of a carefully calibrated phantom, or knowledge of the machine-implemented filter. The simpler approach followed below is to start with different blurring PSFs, and choose the most suitable one by analyzing the results on a known case study.
Some examples of reasonably good approximating PSFs associated with the classical Fejér, Jackson and Valleé Poussin (ref. Natanson [1]) blurrings are shown in Graph 1. Of these, the Fejér blurring was found to be highly satisfactory for the standard 256 x 256 MRI reconstructions.
Method and Materials
Following the approach in ref. Rathore [2], we'll denote the actual cross-section as f, and the local blurring operator as U. The filtered image could then be modeled as f ® Uf + N, where N is the residual dissipated noise in the image. Postulating an approximation A of U, the proposed class of sharpening operators is given by the equation:
If ||D|| =||I-A||<1, it can be shown that Am(Uf) – f ® A-1(U-A) f and ||AmN|| £ [(1-||D||m)/(1-||D||)]||N||. The resulting error in the application of Am for a moderate m would have the order of approximation of the modeling error, and the noise could increase by maximum multiplicative bound (1-||D||)-1, which would normally be of the order of unity. In these reconstructions, A is chosen as well known Féjer operator (ref. Natanson [1] for details). In general, the degree of approximation would be higher for the smoother structures in the cross-section (ref. Rathore [3]).
The technique was tested on data from 250 patients who had undergone MRI for different pathologies involving the brain and spine. The images were obtained with different pulse sequences such as conventional spin echo and gradient echo, and the resulting images were subjected to the above technique to assess resolution enhancement.
The enhancement was independently confirmed by two MR radiologists with more than 10 years of experience in MR image interpretation. The resolution was considered enhanced if lesions became more conspicuous following application of the technique.
Further resolution testing was done on a pig muscle full of cysticercal cysts. The number of cysts seen before and after applying the technique were compared with actual counting ex vivo. More were seen on postprocessed images than on preprocessed images, and were found to equal the actual number of cysts.
Results and Discussion
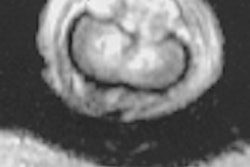
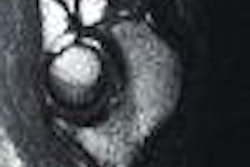
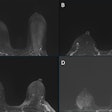
Figure 1 has three rows of images, in each of which the first image A1 is the unprocessed one. The first two rows subsequently display the first to third iterates A2, A3, and A4, while in the last row the second image corresponds to the third iterate A4. For the first routine SE image (TE = 80 ms, TR = 2200 ms), the mean (m) and standard deviation (s) statistics were computed for some three ROIs and displayed in Table 1.
It is apparent that m in different regions is not affected much, while the s increases in the sharpened images with the increase in the index m. This is expected, as a higher resolution implicitly means more discrimination and consequently greater variability.
Row 2 of Fig. 1 corresponds to a gradient echo BOLD-image (TE = 46 ms and TR = 93 ms) and shows the progressive sharpness of the resolution in the iterates A2, A3, and A4 equally well.
Row 3 of Fig. 1 shows multiple lesions in the lateral rectus of the right eye of a patient. The eccentrically placed scolex is more clearly visible in the postprocessed image A4 as compared to the preprocessed A1. Demonstration of the scolex is essential for the diagnosis of cysticercal cyst, as it is pathognomonic of this condition. In the numerous reconstructions obtained by our technique, we found no artifacts or lesion degradations. The sharpness achieved in all cases has been encouraging.
Conclusion
The technique was found to be a very promising tool for reducing blurring in MRI images. The resulting images were sharp, and did not show artifacts or lesion degradation. In our clinical practice, the technique has led to several successful diagnoses of pathologies that would otherwise have been categorized as borderline cases at best.
[1] Natanson, I.P., Constructive Function Theory, Vol. 1, Frederick Ungar, New York, 1964.
[2] Rathore, R.K.S., JMAA, Academic Press, New York and London, Vol.188, 1994, pp. 398-409.
[3] Rathore, R.K.S., JAT, Academic Press, New York and London, Vol. 77, 1994, pp. 153-166.
This study was originally presented as a poster at the International Society for Magnetic Resonance in Medicine 2000 conference in Denver, CO, USA April 3-7, 2000.
August 2000
Copyright © 2000 AuntMinnie.com
Introduction
The requirements for filtering MRI images are different from the techniques used to process digital images. While digital images are processed to compensate for image degradation, the purpose of MRI filtering is to reduce the data noise associated with the high frequency terms in the K-space.
The resulting MRI images, however, appear blurred or unfocused. Thus, assuming that image noise is effectively diminished in the filtering process, we propose a de-blurring step based on any good approximation of a localized spatial blurring model.
An ideal determination of the blurring model approximation has to use machine reconstruction of a carefully calibrated phantom, or knowledge of the machine-implemented filter. The simpler approach followed below is to start with different blurring PSFs, and choose the most suitable one by analyzing the results on a known case study.
Some examples of reasonably good approximating PSFs associated with the classical Fejér, Jackson and Valleé Poussin (ref. Natanson [1]) blurrings are shown in Graph 1. Of these, the Fejér blurring was found to be highly satisfactory for the standard 256 x 256 MRI reconstructions.
Method and Materials
Following the approach in ref. Rathore [2], we'll denote the actual cross-section as f, and the local blurring operator as U. The filtered image could then be modeled as f ® Uf + N, where N is the residual dissipated noise in the image. Postulating an approximation A of U, the proposed class of sharpening operators is given by the equation:
If ||D|| =||I-A||<1, it can be shown that Am(Uf) – f ® A-1(U-A) f and ||AmN|| £ [(1-||D||m)/(1-||D||)]||N||. The resulting error in the application of Am for a moderate m would have the order of approximation of the modeling error, and the noise could increase by maximum multiplicative bound (1-||D||)-1, which would normally be of the order of unity. In these reconstructions, A is chosen as well known Féjer operator (ref. Natanson [1] for details). In general, the degree of approximation would be higher for the smoother structures in the cross-section (ref. Rathore [3]).
The technique was tested on data from 250 patients who had undergone MRI for different pathologies involving the brain and spine. The images were obtained with different pulse sequences such as conventional spin echo and gradient echo, and the resulting images were subjected to the above technique to assess resolution enhancement.
The enhancement was independently confirmed by two MR radiologists with more than 10 years of experience in MR image interpretation. The resolution was considered enhanced if lesions became more conspicuous following application of the technique.
Further resolution testing was done on a pig muscle full of cysticercal cysts. The number of cysts seen before and after applying the technique were compared with actual counting ex vivo. More were seen on postprocessed images than on preprocessed images, and were found to equal the actual number of cysts.
Results and Discussion
Figure 1 has three rows of images, in each of which the first image A1 is the unprocessed one. The first two rows subsequently display the first to third iterates A2, A3, and A4, while in the last row the second image corresponds to the third iterate A4. For the first routine SE image (TE = 80 ms, TR = 2200 ms), the mean (m) and standard deviation (s) statistics were computed for some three ROIs and displayed in Table 1.
It is apparent that m in different regions is not affected much, while the s increases in the sharpened images with the increase in the index m. This is expected, as a higher resolution implicitly means more discrimination and consequently greater variability.
Row 2 of Fig. 1 corresponds to a gradient echo BOLD-image (TE = 46 ms and TR = 93 ms) and shows the progressive sharpness of the resolution in the iterates A2, A3, and A4 equally well.
Row 3 of Fig. 1 shows multiple lesions in the lateral rectus of the right eye of a patient. The eccentrically placed scolex is more clearly visible in the postprocessed image A4 as compared to the preprocessed A1. Demonstration of the scolex is essential for the diagnosis of cysticercal cyst, as it is pathognomonic of this condition. In the numerous reconstructions obtained by our technique, we found no artifacts or lesion degradations. The sharpness achieved in all cases has been encouraging.
Conclusion
The technique was found to be a very promising tool for reducing blurring in MRI images. The resulting images were sharp, and did not show artifacts or lesion degradation. In our clinical practice, the technique has led to several successful diagnoses of pathologies that would otherwise have been categorized as borderline cases at best.
R.K.S. Rathore, Ph.D., D.Sc., V.S.N. Kali Prasad, S.B. Rao, and Sushmita Datta are with the Department of Mathematics, Indian Institute of Technology, Kanpur - 208016, India. R.K. Gupta, M.D. is a member of the Department of Radiology, Sanjay Gandhi Post Graduate Institute of Medical Sciences, Lucknow - 226014, India.
References[1] Natanson, I.P., Constructive Function Theory, Vol. 1, Frederick Ungar, New York, 1964.
[2] Rathore, R.K.S., JMAA, Academic Press, New York and London, Vol.188, 1994, pp. 398-409.
[3] Rathore, R.K.S., JAT, Academic Press, New York and London, Vol. 77, 1994, pp. 153-166.
This study was originally presented as a poster at the International Society for Magnetic Resonance in Medicine 2000 conference in Denver, CO, USA April 3-7, 2000.
August 2000
Copyright © 2000 AuntMinnie.com

