How do radiation oncology departments make the best use of their resources while also ensuring patient safety? One department did so by developing its own quality assurance software tool to track errors, in some cases before they even occur.
Staff at Washington University School of Medicine (WUSM) in St. Louis developed the software application to capture and quantify actual and potential errors of any kind, track corrected mistakes, and identify anomalies in department operations. They described their work in a presentation at the annual meeting of the American Association of Physicists in Medicine (AAPM) last week in Houston.
The software was specifically designed to identify potential problems before they can result in treatment errors and has become an indispensable aid for process improvement, according to Sasa Mutic, associate professor of radiation oncology and chief of clinical medical physics services at WUSM. It was developed by dosimetrists, nurses, physicians, physicists, therapists, and administrative staff at WUSM's department of radiation oncology.
Tracking 'near misses'
QA managers at all radiation oncology departments are challenged by the need to keep their programs updated, relevant, and effective in an environment of rapid and continuous change. Guidelines by professional associations and regulatory agencies are helpful but are typically outdated by the time they are published, so most hospitals develop their own QA guidelines. In addition to the lack of timely guidelines, there is often a shortage of qualified personnel, as well as inadequate guidance for resource allocation, according to Mutic.
Checks, balances, and rigorous evaluation keep error rates low. For example, over the 30-year period that WUSM has kept incidence reports, only 300 have been submitted for the tens of thousands of radiation therapy procedures performed. Each was evaluated in the context of improving performance, and corrective actions were taken.
But instance reports focus on outright errors and do not provide a good means of tracking the "near misses" that could have been errors but weren't, according to Mutic. Tracking these near misses can be an invaluable tool for process improvement.
"There may be 50 near misses for every hit, but if you are only counting the errors, how do you know where underlying weaknesses are in your department?" Mutic said. "Quality assurance resources may be targeted toward areas that never fail, while completely ignoring areas with significant potential for failure."
WUSM's database has been designed for ease of use to rapidly and accurately report an "event." The software consists of decision-tree pull-down menus that facilitate accurate categorization and require a minimum amount of input from staff, if any. Once an event is logged, depending upon severity it is communicated to a designated supervisor by e-mail, text message, or paper. The type of event determines who will evaluate it and subsequent actions to be taken.
The program has been wholeheartedly adopted by the clinicians and staff of the radiation oncology department because the information reported is exclusively used for analysis and process improvement. The data are never used in a negative way against any employee. This factor -- and the program's ease of use -- are the primary reasons for department-wide acceptance, according to Mutic.
"Radiation oncology is a team endeavor. Our staff has the mindset to never trust or assume anything, and we operate with long-established procedures to double- and triple-check everything," Mutic explained. "Any process where a single person can make an error is a process that has a flaw somewhere within its environment that needs to be corrected. Staff who report events are doing their job."
Since its implementation in mid-August 2007, more than 2,000 entries have been made regarding radiation therapy procedures for some 2,600 patients. Many of these entries were not caused by the department but are issues that affect it, such as recording late arrivals by patients, missed appointments, or failure of staff to find transportation for patients who need it.
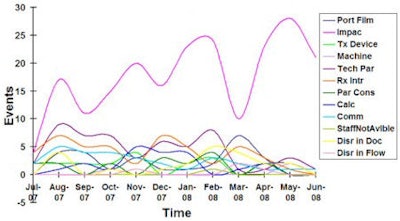
IMPAC entries
 |
| Line graph showing data entry events into the IMPAC software by operational area for the first 10 months of clinical use of the software and QA process. Images courtesy of Sasa Mutic. |
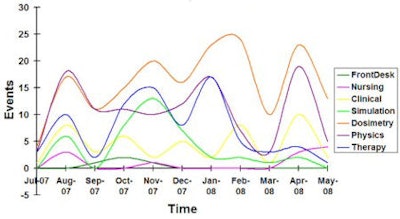
Dosimetry monthly events report
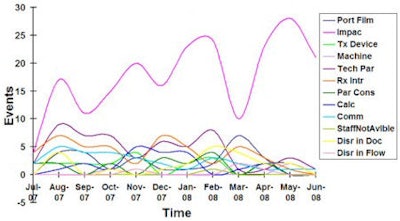 |
| Line graph showing most prevalent event types for dosimetry area for the first 10 months of clinical use of the software and QA process. |
Other events represent data entry errors that were discovered and corrected, incomplete or unsigned consent forms for therapy, or a late deliverable by a physicist. But all of these affect the performance of the department.
For example, WUSM's department didn't realize how much incomplete and/or unsigned consent forms were affecting its operations until it had data to analyze. When a patient would arrive for a scheduled appointment with an incomplete consent form, a staff member would need to delay treatment until a physician could be found. This would throw off the schedule, typically make patients wait 30-60 minutes, and consume staff time in a wasteful activity.
With tangible data, the database identified that consent forms were incomplete on an average of 8% each month. This fact was presented to the hospital's oncologists, who became more aware of the consequences of unsigned forms. The department also implemented a protocol to verify that consent forms had been signed and were completed two to three days prior to a scheduled treatment.
Policies have been rewritten to eliminate ambiguities or confusing protocols that can cause misinterpretation and clinical mistakes. When staff members are made aware of the number of mistakes that are caught and corrected by someone else, they become self-motivated to improve their performance. This was particularly impressive with the therapy and simulation staff, Mutic said.
The biggest surprise in implementing the QA tool was learning that events can be cyclical. Mutic said that the database will be modified to enable data to be collected for comparison of patient load as a function of time, vacation days as a function of time, and new software/hardware upgrades as a function of time, among other factors.
The detail of the data available in the QA tool facilitates evaluation of events per type of treatment and per type of task. Data "noise" that previously was invisible or anecdotally conveyed can now be analyzed to determine precisely how it impacts the department.
"When we implemented the program, we did not identify any major oversights, because the procedures and protocols that we've implemented for the past 30 years have been very effective," Mutic said. "But the database analysis tool makes potential problems and inefficiencies visible. By using this IT tool, we have become a better department."
By Cynthia Keen
AuntMinnie.com staff writer
August 6, 2008
Related Reading
AHRQ sets 2008 target for error reporting system, August 24, 2007
Copyright © 2008 AuntMinnie.com
