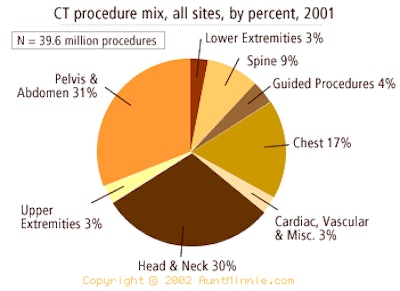
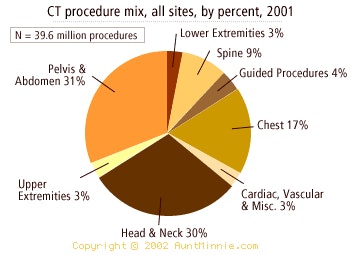
Pelvis and abdomen procedures constituted 31% of total volume, followed closely by head and neck, with 30%. The categories with the next highest volumes are chest with 17%, and spine with 9%.
MarketStat Archives
PET procedures per site.
Echocardiography staff productivity.
Cardiac cath lab case mix.
Radiation oncology -- distribution of external beam therapy units.
MRI productivity
Fluoroscopy procedure volume per site
Angiography procedure volume
Number of planned CR purchases
Top planned PACS applications
U.S. nuclear medicine utilization by top 10 states
Angiography room productivity
Nuclear medicine productivity
CT productivity per device
Mammography procedures per mammography unit
 |
AuntMinnie's IMV MarketStat is provided to AuntMinnie.com by IMV Medical Information Division, Inc. of Des Plaines, IL.


