Attrition doesn’t appear to be a significant contributing factor in the shortage of radiologists in the U.S., according to research published July 23 in Radiology.
After analyzing Medicare billing data from 2019 to 2024, researchers from NYU Langone Health in New York City found that radiologists have a lower national attrition rate than other healthcare providers.
“The findings suggest that attrition is not a primary driver of the current national radiologist workforce shortage, and that other potential drivers should be explored,” wrote Andrew Rosenkrantz, MD, and Ryan Cummings, MD.
As the causes of the current radiologist shortage are unclear, the researchers sought in their study to explore the possibility that radiologists have a high rate of attrition, defined as switching to a different career or retiring early.
In their retrospective analysis, the authors used datasets from the U.S. Centers of Medicare and Medicaid Services (CMS) to compare national workforce attrition rate of radiologists with that of other specialists. These CMS datasets from 2015 to 2024 included information about providers newly enrolled in Medicare or who have submitted at least one claim in the previous six months.
Utilizing archive files representing a six-month window from January and February 2024, the researchers calculated a workforce attrition percentage by classifying providers who were consistently in practice from 2015 to 2019 and who were no longer in practice in 2024. They then used archive files from 2021-2023 to calculate an attrition rate for those years and a cumulative attrition rate for 2021-2024.
Of the 363,504 providers who consistently practiced from January 2015 to December 2019, 23,496 were radiologists (having a primary specialty code of diagnostic radiology, interventional radiology, or nuclear medicine).
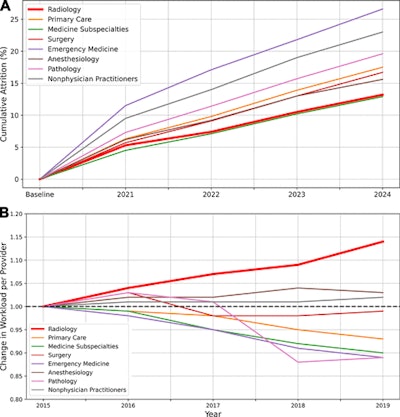
Attrition among specialties was as follows:
- Average among all providers: 16.4%
- Emergency medicine physicians: 26.6%
- Nonphysician practitioners: 23%
- Pathologists: 19.6%
- Primary care physicians: 17.5%
- Surgeons: 16.7%
- Anesthesiologists: 15.6%
- Radiologists: 13.2%
- Medicine subspecialists: 12.9%
Delving further into the data, the researchers found that among radiologists, men and women had attrition rates of 13.5% and 12%, respectively. Furthermore, they calculated a 6% attrition rate among those younger than 65 and 2.9% attrition in those with an estimated age of less than 45.
“Across genders and age groups, radiologists consistently had low attrition relative to other specialties,” Rosenkrantz and Cummings wrote.
On a statewide basis, Montana had the highest attrition rate (25.4%), including 16 of 63 radiologists. With a 10.3% attrition rate (77 of 747 radiologists), New Jersey had the lowest attrition, according to the researchers.
In a secondary analysis that assessed shifts in workload per provider over time, the researchers observed that radiologists had the highest increase in relative workload compared with other provider categories.
 (A) Graph shows cumulative attrition according to specialty. Baseline represents all providers in consistent practice from 2015 to 2019. Cumulative attrition for each year represents the percentage of providers at baseline who were absent in both the January and February archive files for the given year, with each such file representing a 6-month period. (B) Graph shows change in the mean workload per provider from 2015 to 2019 stratified according to specialty. Each provider’s workload in a given year was defined as that provider’s service count weighted by each service’s work relative value units. Each specialty’s mean value in 2015 was assigned a value of 1.00. Relative workload in 2019 increased (in order from greatest to smallest increase) for radiology (1.14), anesthesiology (1.03), and nonphysician practitioners (1.02) and decreased (in order from greatest to smallest decrease) for emergency medicine (0.89), pathology (0.89), medicine subspecialties (0.90), primary care (0.93), and surgery (0.99). Charts and caption courtesy of Radiology.
The researchers concluded that other factors besides attrition should be considered as primary contributors to the nationwide radiologist shortage.
“For example, another potential driver is insufficient annual influx of new radiologists; the Accreditation Council for Graduate Medical Education reported a total of 5541 diagnostic and interventional radiology residents (across all training years) in 2022–2023,” the authors wrote.
The full journal article can be found here.


