The use of photon-counting CT (PCCT) spectral localization shows promise as a way to opportunistically screen for low bone mass and osteoporosis and generate T-scores (used to assess bone density), researchers have reported.
The results could address the problem of poor patient compliance with dual-energy x-ray, wrote a team led by Ahmed El Sadaney, BCh, of the Mayo Clinic in Rochester, MN. The findings were published October 30 in the American Journal of Roentgenology.
"Patients who do not undergo recommended osteoporosis screening could benefit from opportunistic testing based on bone mineral density values derived from other clinically indicated imaging, whether derived retrospectively from previously acquired examinations or prospectively from contemporaneous examinations," the group noted.
The study used data from 51 individuals 18 years or older who underwent lumbar spine PCCT imaging between October 2023 and February 2024 and who also underwent DEXA imaging 13 months before the CT exam. The PCCT exams included spectral localizer images; the investigators used area bone mineral density values found on DEXA reports to derive T-scores (these represent the difference between an individual's bone density and the average bone density of healthy young adults, with normal bone mass T-scores at -1 or higher and abnormal ones below -1). The team then compared DEXA and PCCT measurements.
The group found that DEXA- and opportunistic PCCT-derived T-scores were comparable.
| Comparison of DEXA and PCCT for assessing bone health via T-scores | ||
|---|---|---|
| Measure | DEXA | PCCT |
| T-score | 0.39 | 0.28 |
Sadaney and colleagues also reported that PCCT correctly classified 90.2% of patients when it came to normal versus abnormal bone mass with respect to DEXA.
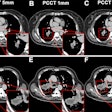
 68-year-old woman who underwent clinically indicated CT of lumbar spine due to persistent low back pain, despite more than six weeks of conservative therapy. Examination was performed using a photon-counting detector (PCD) CT scanner. (A) Spectral localizer image. (B,C) Hydroxyapatite (HA) map (B) and water map (C), generated using material decomposition of spectral localizer image. On HA map, red overlays indicate ROIs placed on L1-L4 vertebral bodies and green overlays indicate ROIs placed on background soft tissue directly adjacent to four corners of representative analyzable vertebral body. On a water map, red overlays indicate ROIs transferred from HA map onto L1-L4 vertebral bodies, and blue overlay indicates ROI placed on background soft tissue remote from vertebral bodies. (D) Image from DXA scan on same day as PCD CT. DXA served as reference standard. Areal bone mineral density (aBMD) values derived from DXA and PCD CT at L1 are 1.109 and 1.163 mg/cm2, at L2 are 1.104 and 1.026 mg/cm2, at L3 are 1.114 and 1.017 mg/cm2, and at L4 are 1.071 and 1.053 mg/cm2. Patient-level (aBMD) is 1.097 for mg/cm2 for DXA and 1.099 mg/cm2 for PCD CT. T-score for DXA is -0.8 and for PCD CT is -0.7. Both modalities classify patient as having normal bone mass.
"[The PCCT] derived T-scores had good performance for detecting abnormal bone mass using DEXA-derived T-scores as the reference standard," the group concluded. "[Our] results suggest that this test may have utility as an opportunistic screening tool for the detection of low bone mass and osteoporosis."
The complete study can be found here.


