Dynamic digital radiography (DDR) has shown for the first time that it can be used to automatically capture lung signal changes during forced breathing in patients with chronic obstructive pulmonary disease (COPD), according to a recent study.
The finding validates fully automated software for use in procedures and advances DDR a step toward clinical use, the technology’s U.S. and Japanese developers wrote.
“This method plays an important role in overcoming the barriers to its clinical implementation, including the need for trained experts and the time-consuming process of manual contouring,” noted lead author Noriaki Wada, MD, of Brigham and Women’s Hospital in Boston. The study was published in the December 2024 issue of the European Journal of Radiology Open.
DDR is a novel functional imaging technique that uses sequential images obtained by a pulsed x-ray generator and a flat panel detector with a large field of view.
Previous studies using DDR have focused on visualizing dynamic changes in lung fields during respiration that reflect changes of air volume inside the alveoli. Recently, however, Wada's group developed fully automated software that continuously contours and tracks lung fields during forced breathing exams.
To test the new technique, the researchers analyzed DDR imaging from 33 COPD patients and 46 healthy subjects. Fifteen of the 33 COPD patients were classified as mild COPD and 18 as severe COPD.
Patients underwent DDR in the standing position, with approximately 10- to 15-second exposure times. Healthy volunteers took several tidal breaths followed by one forced breath, while COPD patients took tidal breaths and a forced breath separately. Dynamic image data was acquired at 7.5 frames per second (COPD patients) or 15 frames per second (healthy volunteers) with synchronized pulsed x-rays.
All participants also underwent spirometry on the same day, with standard spirometry test parameters such as forced vital capacity (VC) and forced expiratory volume in 1 second (FEV1) acquired for each.
DDR lung signal changes were quantified as the maximum average signal intensity of lung fields in inspiratory phase (SImax) divided by the minimum average signal intensity of lung fields in expiratory phase (SImin) during forced breathing.
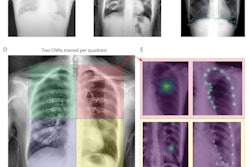
 Representative chest radiographs and graphs of lung signal intensity obtained using DDR for the severe COPD group. The subject is a 77-year-old male with VC of 1.68 L and FEV1 of 0.68 L. (a) Radiograph during forced inspiration when the average signal intensity reached its maximum (SImax = 3879.3). (b) Radiograph during forced expiration when the average signal intensity reached its minimum (SImin = 3466.5). (c) Curve graphs depict the temporal change in the signal intensity of entire lung and each individual lung, tracked automatically during respiration, including forced breathing. The signal intensity change (SImax/SImin) was calculated as 1.12. Image courtesy of the European Journal of Radiology Open.
According to the findings, SImax/SImin showed the highest correlation with VC (Spearman's rank correlation coefficient [rs] = 0.54, P < 0.0001), followed by FEV1 (rs = 0.44, p < 0.0001), both of which are key indicators of COPD pathophysiology, the researchers wrote. SImax/SImin was significantly lower in the severe COPD group compared with the normal group (p = 0.0004) and mild COPD group (p = 0.0022).
However, the researchers noted no significant difference in the SImax/SImin between the mild and the normal groups.
“This is the first report to focus on the signal intensity changes of the entire lung fields on DDR images in COPD patients and investigate the correlation with [spirometry] parameters and the differences by disease severity,” the group wrote.
The findings highlight DDR’s potential for providing additional insights into COPD pathophysiology, enhancing diagnostic accuracy, and improving patient care, the authors wrote. They noted that larger prospective studies with standardized methodologies are needed to evaluate the reproducibility of the findings and address limitations regarding technique and result interpretation.
“Further research is needed to validate the utility of DDR in COPD diagnosis and management before widespread clinical adoption,” they concluded.
The full study is available here.


![Representative example of a 16-year-old male patient with underlying X-linked adrenoleukodystrophy. (A, B) Paired anteroposterior (AP) chest radiograph and dual-energy x-ray absorptiometry (DXA) report shows lumbar spine (L1 through L4) areal bone mineral density (BMD). The DXA report was reformatted for anonymization and improved readability. The patient had low BMD (Z score ≤ −2.0). (C) Model (chest radiography [CXR]–BMD) output shows the predicted raw BMD and Z score in comparison with the DXA reference standard, together with interpretability analyses using Shapley additive explanations (SHAP) and gradient-weighted class activation maps. The patient was classified as having low BMD, consistent with the reference standard. AM = age-matched, DEXA = dual-energy x-ray absorptiometry, RM2 = room 2, SNUH = Seoul National University Hospital, YA = young adult.](https://img.auntminnie.com/mindful/smg/workspaces/default/uploads/2026/04/ai-children-bone-density.0snnf2EJjr.jpg?auto=format%2Ccompress&fit=crop&h=100&q=70&w=100)


![Representative example of a 16-year-old male patient with underlying X-linked adrenoleukodystrophy. (A, B) Paired anteroposterior (AP) chest radiograph and dual-energy x-ray absorptiometry (DXA) report shows lumbar spine (L1 through L4) areal bone mineral density (BMD). The DXA report was reformatted for anonymization and improved readability. The patient had low BMD (Z score ≤ −2.0). (C) Model (chest radiography [CXR]–BMD) output shows the predicted raw BMD and Z score in comparison with the DXA reference standard, together with interpretability analyses using Shapley additive explanations (SHAP) and gradient-weighted class activation maps. The patient was classified as having low BMD, consistent with the reference standard. AM = age-matched, DEXA = dual-energy x-ray absorptiometry, RM2 = room 2, SNUH = Seoul National University Hospital, YA = young adult.](https://img.auntminnie.com/mindful/smg/workspaces/default/uploads/2026/04/ai-children-bone-density.0snnf2EJjr.jpg?auto=format%2Ccompress&dpr=2&fit=crop&h=167&q=70&w=250)


