
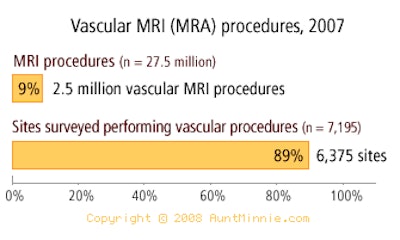
As of IMV's 2007 census survey, 89% of all MRI sites have performed vascular MRI (MR angiography [MRA]) procedures. Of the 27.5 million MRI procedures performed in 2007, 9% (2.5 million) were vascular MRI (MRA) procedures.

Based on responses to IMV’s 2007 MRI Census Survey of U.S. Hospitals and Nonhospitals.
AuntMinnie's IMV MarketStat is provided to AuntMinnie.com by IMV Medical Information Division, Inc. of Des Plaines, IL.

Click here to buy complete IMV Market Reports
MarketStat ArchivesSingle versus multislice detectors in CT installed base
Budgets for nuclear medicine radiopharmaceuticals
Formats used for images sent or received by radiation oncology departments
MRI adult versus pediatric patient visit mix
Cath lab device budgets for 2006
Average CT procedures per technologist vs. total staff FTE
Percentage of U.S. hospitals with DR or CR technology
Fixed PET versus PET/CT installed base
Nuclear medicine -- Camera installed base
Staffing configurations in diagnostic ultrasound sites, by staff type
Lead time for scheduling a screening mammography appointment
Mix of 2004 angiography catheter/stent budgets
Radiographic fluoroscopy installed base, by table configuration
Types of images used in radiation therapy treatment plans
Transmission of echo images
MRI sites having at least one power injector
Mix of CT scanners by detector type
Mobile versus fixed PET or PET/CT sites and scanners
Cardiac versus noncardiac cath lab cases
External-beam patients per external-beam treatment unit
Distribution of nuclear medicine cameras, by type
Proportion of filmless procedures
CT procedure volume per site
Angiography procedure volume
Percent of MRI procedures using contrast media
Staffing of fixed PET sites
Cardiac cath imaging systems, by type
Radiation oncology patient mix
Fluoro contrast use
Distribution of CT sites
Clinical PET procedure mix
Distribution of radiology information systems
PACS shared image archiving
Mobile MRI vs. fixed MRI sites.
PET procedures per site
Echocardiography staff productivity
Cardiac cath lab case mix
Radiation oncology -- distribution of external beam therapy units
MRI productivity
Fluoroscopy procedure volume per site
Angiography procedure volume
Number of planned CR purchases
Top planned PACS applications
U.S. nuclear medicine utilization by top 10 states
Angiography room productivity
Nuclear medicine productivity
CT productivity per device
Mammography procedures per mammography unit

![Overview of the study design. (A) The fully automated deep learning framework was developed to estimate body composition (BC) (defined as subcutaneous adipose tissue [SAT] in liters; visceral adipose tissue [VAT] in liters; skeletal muscle [SM] in liters; SM fat fraction [SMFF] as a percentage; and intramuscular adipose tissue [IMAT] in deciliters) from MRI. The fully automated framework comprised one model (model 1) to quantify different BC measures (SAT, VAT, SM, SMFF, and IMAT) as three-dimensional (3D) measures from whole-body MRI scans. The second model (model 2) was trained to identify standardized anatomic landmarks along the craniocaudal body axis (z coordinate field), which allowed for subdividing the whole-body measures into different subregions typically examined on clinical routine MRI scans (chest, abdomen, and pelvis). (B) BC was quantified from whole-body MRI in over 66,000 individuals from two large population-based cohort studies, the UK Biobank (UKB) (36,317 individuals) and the German National Cohort (NAKO) (30,291 individuals). Bar graphs show age distribution by sex and cohort. BMI = body mass index. (C) After the performance assessment of the fully automated framework, the change in BC measures, distributions, and profiles across age decades were investigated. Age-, sex-, and height-adjusted body composition reference curves were calculated and made publicly available in a web-based z-score calculator (https://circ-ml.github.io).](https://img.auntminnie.com/mindful/smg/workspaces/default/uploads/2026/05/body-comp.XgAjTfPj1W.jpg?auto=format%2Ccompress&fit=crop&h=100&q=70&w=100)


![Overview of the study design. (A) The fully automated deep learning framework was developed to estimate body composition (BC) (defined as subcutaneous adipose tissue [SAT] in liters; visceral adipose tissue [VAT] in liters; skeletal muscle [SM] in liters; SM fat fraction [SMFF] as a percentage; and intramuscular adipose tissue [IMAT] in deciliters) from MRI. The fully automated framework comprised one model (model 1) to quantify different BC measures (SAT, VAT, SM, SMFF, and IMAT) as three-dimensional (3D) measures from whole-body MRI scans. The second model (model 2) was trained to identify standardized anatomic landmarks along the craniocaudal body axis (z coordinate field), which allowed for subdividing the whole-body measures into different subregions typically examined on clinical routine MRI scans (chest, abdomen, and pelvis). (B) BC was quantified from whole-body MRI in over 66,000 individuals from two large population-based cohort studies, the UK Biobank (UKB) (36,317 individuals) and the German National Cohort (NAKO) (30,291 individuals). Bar graphs show age distribution by sex and cohort. BMI = body mass index. (C) After the performance assessment of the fully automated framework, the change in BC measures, distributions, and profiles across age decades were investigated. Age-, sex-, and height-adjusted body composition reference curves were calculated and made publicly available in a web-based z-score calculator (https://circ-ml.github.io).](https://img.auntminnie.com/mindful/smg/workspaces/default/uploads/2026/05/body-comp.XgAjTfPj1W.jpg?auto=format%2Ccompress&dpr=2&fit=crop&h=167&q=70&w=250)


