An artificial intelligence (AI) algorithm can distinguish patients with major depressive disorder (MDD) from those who have bipolar disorder based on an analysis of functional MRI (fMRI) studies, according to research published online August 6 in Acta Psychiatrica Scandinavica. The algorithm can also predict response to medication.
Researchers from the Lawson Health Research Institute in London, Ontario, and the Mind Research Network in Albuquerque, NM, developed the machine-learning algorithm, which yielded more than 92% accuracy in differentiating between patients known to have MDD or bipolar disorder. What's more, it was more than 91% accurate in predicting medication response in a small group of patients with complex mood disorders but unclear diagnoses.
"This study takes a major step towards finding a biomarker of medication response in emerging adults with complex mood disorders," said co-lead investigator Dr. Elizabeth Osuch in a statement from Lawson. "It also suggests that we may one day have an objective measure of psychiatric illness through brain imaging that would make diagnosis faster, more effective, and more consistent across healthcare providers."
Osuch is a clinician-scientist at Lawson and medical director of the London Health Sciences Centre's First Episode Mood and Anxiety Program (FEMAP).
It can be difficult for psychiatrists to differentiate bipolar disorder from major depressive disorder in patients without obvious mania, and patients with bipolar disorder are frequently misdiagnosed -- often for years -- as having MDD.
To see if a machine-learning algorithm could help predict medication response in patients with challenging mood diagnoses, the researchers enrolled 78 emerging adult patients from mental health programs at the London Health Sciences Centre. Of the 78 patients, 66 had completed treatment for a clear diagnosis of either MDD or bipolar type 1; 12 had complex mood disorders with an unclear diagnosis. The researchers also included an additional 33 participants with no history of mental illness.
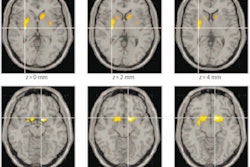
After analyzing the fMRI scans of those with MDD, bipolar type 1, and no history of mental illness, Osuch and colleagues found that brain activity between the three groups differed in certain areas, including in the default mode network -- known to be important for self-reflection -- as well as in the thalamus -- a "gateway" that connects multiple cortical regions and helps control arousal and alertness. The data were then used to train and cross-validate the predictive algorithm.
In testing on the 66 patients with a known diagnosis of MDD or bipolar type 1, the algorithm produced 92.4% accuracy in differentiating between the conditions. Next, the researchers applied the algorithm to predict diagnosis and response to medication in the 12 patients who had an unclear diagnosis. They hypothesized that participants classified by the algorithm as having MDD would respond to antidepressants, while those classified as having bipolar type 1 would respond to mood stabilizers.
Indeed, 11 of the 12 patients (91.7%) responded to the medication predicted by the algorithm, according to the researchers.
"Further research can extend these findings to develop an accessible neurofunctional biomarker for the diagnosis of mood and other psychiatric disorders," they wrote.