

The first MRI study comparing autism spectrum disorder (ASD) and fragile X syndrome in infants has demonstrated strikingly different patterns of brain and behavior development between the conditions, according to a study published March 25 in the American Journal of Psychiatry.
Scientists from the U.S. National Institutes of Health (NIH) performed MRI scans of 408 infants at 6, 12, and 24 months of age. Two-hundred and seventy of the infants were at higher likelihood of ASD because they had an older sibling with ASD; 109 were typically developing infants; and 29 infants had fragile X syndrome, an inherited form of developmental and intellectual disability.
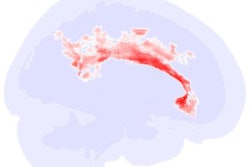
The imaging revealed that increased amygdala growth rates occur between 6 and 12 months, prior to social deficits and well before diagnosis. The gradual onset of brain and behavior changes was observed in ASD but not fragile X syndrome, which suggests an age- and disorder-specific pattern of cascading brain changes preceding autism diagnosis, according to the authors. Moreover, the faster the rate of amygdala overgrowth, the greater the severity of ASD symptoms at 24 months.
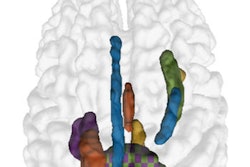
Infants with fragile X syndrome had a distinct pattern of brain growth. They had no differences in amygdala growth but enlargement of another brain structure, the caudate, which was linked to increased repetitive behaviors, according to the study findings.
Ultimately, the researchers found that therapies to reduce the symptoms of ASD might have the greatest chance of success if they begin in the first year of life, before the amygdala begins its accelerated growth.


![Overview of the study design. (A) The fully automated deep learning framework was developed to estimate body composition (BC) (defined as subcutaneous adipose tissue [SAT] in liters; visceral adipose tissue [VAT] in liters; skeletal muscle [SM] in liters; SM fat fraction [SMFF] as a percentage; and intramuscular adipose tissue [IMAT] in deciliters) from MRI. The fully automated framework comprised one model (model 1) to quantify different BC measures (SAT, VAT, SM, SMFF, and IMAT) as three-dimensional (3D) measures from whole-body MRI scans. The second model (model 2) was trained to identify standardized anatomic landmarks along the craniocaudal body axis (z coordinate field), which allowed for subdividing the whole-body measures into different subregions typically examined on clinical routine MRI scans (chest, abdomen, and pelvis). (B) BC was quantified from whole-body MRI in over 66,000 individuals from two large population-based cohort studies, the UK Biobank (UKB) (36,317 individuals) and the German National Cohort (NAKO) (30,291 individuals). Bar graphs show age distribution by sex and cohort. BMI = body mass index. (C) After the performance assessment of the fully automated framework, the change in BC measures, distributions, and profiles across age decades were investigated. Age-, sex-, and height-adjusted body composition reference curves were calculated and made publicly available in a web-based z-score calculator (https://circ-ml.github.io).](https://img.auntminnie.com/mindful/smg/workspaces/default/uploads/2026/05/body-comp.XgAjTfPj1W.jpg?auto=format%2Ccompress&fit=crop&h=100&q=70&w=100)


![Overview of the study design. (A) The fully automated deep learning framework was developed to estimate body composition (BC) (defined as subcutaneous adipose tissue [SAT] in liters; visceral adipose tissue [VAT] in liters; skeletal muscle [SM] in liters; SM fat fraction [SMFF] as a percentage; and intramuscular adipose tissue [IMAT] in deciliters) from MRI. The fully automated framework comprised one model (model 1) to quantify different BC measures (SAT, VAT, SM, SMFF, and IMAT) as three-dimensional (3D) measures from whole-body MRI scans. The second model (model 2) was trained to identify standardized anatomic landmarks along the craniocaudal body axis (z coordinate field), which allowed for subdividing the whole-body measures into different subregions typically examined on clinical routine MRI scans (chest, abdomen, and pelvis). (B) BC was quantified from whole-body MRI in over 66,000 individuals from two large population-based cohort studies, the UK Biobank (UKB) (36,317 individuals) and the German National Cohort (NAKO) (30,291 individuals). Bar graphs show age distribution by sex and cohort. BMI = body mass index. (C) After the performance assessment of the fully automated framework, the change in BC measures, distributions, and profiles across age decades were investigated. Age-, sex-, and height-adjusted body composition reference curves were calculated and made publicly available in a web-based z-score calculator (https://circ-ml.github.io).](https://img.auntminnie.com/mindful/smg/workspaces/default/uploads/2026/05/body-comp.XgAjTfPj1W.jpg?auto=format%2Ccompress&dpr=2&fit=crop&h=167&q=70&w=250)


