


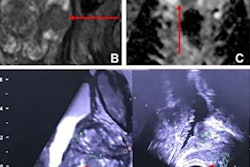
Performance varies among radiologists when it comes to interpreting multiparametric MRI (mpMRI) prostate exams, but for the most part, they can consistently identify clinically significant prostate cancer, according to a study published on October 13 in the Journal of the American College of Radiology.
The results are good news for men with elevated prostate-specific antigen (PSA) levels who are getting a cancer workup, noted a team led by medical student Sachin Naik of Harvard Medical School in Boston.
"Our findings suggest that the known variation in radiologist mpMRI interpretation does not meaningfully impact clinically significant prostate cancer detection and patient outcomes in a multidisciplinary highly subspecialized prostate cancer program," the researchers wrote.
The European Society of Urogenital Radiology released the Prostate Imaging Reporting and Data System (PI-RADS) scoring framework in 2012, a system which includes guidance regarding the use of mpMRI for identifying prostate cancer, and the technique is now commonly used with men with elevated PSA. Since PI-RADS was released, researchers have sought to assess the reproducibility of its scoring, with some studies focusing on variations in radiologist interpretation.
Yet it hasn't been determined how PI-RADS scoring can be affected by a variety of elements (i.e., the type of physician who ordered the exam; the sex, years in practice, and level of experience of the interpreting radiologist; patient characteristics such as age, race, insurance status; and technical, report, and pathology factors), according to Naik and colleagues.
To clarify the question, they conducted a study that included data from 928 men with elevated PSA (equal to or more than 4 ng/mL) who underwent 960 mpMRI exams for prostate cancer between January 2015 and December 2019. The authors identified patient characteristics from Harvard's Research Patient Data Registry and radiologist characteristics from the department's administrative database. Each patient's PI-RADS score and grade group was determined from imaging and pathology reports using a natural language processing (NLP) algorithm. Two radiologists validated these NLP results via manual chart review.
The team defined the study's primary outcome as the identification of prostate cancer at or higher than grade group 2 (that is, a Gleason score of 3 + 4 = 7, which indicates that the cancer has not metastasized).
Of the study participants, most (85.8%) were white and all had health insurance. More than half (59.8%) of the men had clinically significant prostate cancer, and 57.8% of the mpMRI reports showed grade group 2 disease.
Not surprisingly, the higher a man's PI-RADS score, the more likely he was to have grade group 2 prostate cancer.
| Relationship between PI-RADS category and mpMRI grade group results | |
| PI-RADS category | Percentage of mpMRI scans that showed grade group equal to or higher than 2 disease |
| 5 | 81.7% |
| 4 | 56.9% |
| 3 | 34.2% |
| 2 | 23.5% |
| 1 | 25% |
| No focal lesion | 40.4% |
| Total grade group 2 for cohort | 57.8% |
The study also showed that the two radiologists' manual chart review of the mpMRI exams agreed with the NLP results 97% of the time for the PI-RADS category and 93% of the time for the disease grade group.
The study showed an association between insurance status and lower prostate cancer risk, but it did not show a connection between prostate cancer severity and patient factors such as age, race, or ethnicity. The team acknowledged, however, that the findings "are likely biased by the predominately White, Non-Hispanic, and fully-insured make-up of our cohort, a bias also seen in previously published studies, and which highlights disparities in the evaluation and treatment of prostate cancer."
More research is needed, according to the authors.
"Coordinated disease-focused subspecialty-trained provider teams, including subspecialty trained radiologists, can deliver consistent and high-quality evaluations for clinically significant prostate cancer using MRI, though further studies should confirm generalizability of results and guide best practice dissemination" they concluded. "Our results also highlight a need to prioritize interventions to help address likely substantial racial and ethnic disparities in care delivery for men with suspected prostate cancer."


![Overview of the study design. (A) The fully automated deep learning framework was developed to estimate body composition (BC) (defined as subcutaneous adipose tissue [SAT] in liters; visceral adipose tissue [VAT] in liters; skeletal muscle [SM] in liters; SM fat fraction [SMFF] as a percentage; and intramuscular adipose tissue [IMAT] in deciliters) from MRI. The fully automated framework comprised one model (model 1) to quantify different BC measures (SAT, VAT, SM, SMFF, and IMAT) as three-dimensional (3D) measures from whole-body MRI scans. The second model (model 2) was trained to identify standardized anatomic landmarks along the craniocaudal body axis (z coordinate field), which allowed for subdividing the whole-body measures into different subregions typically examined on clinical routine MRI scans (chest, abdomen, and pelvis). (B) BC was quantified from whole-body MRI in over 66,000 individuals from two large population-based cohort studies, the UK Biobank (UKB) (36,317 individuals) and the German National Cohort (NAKO) (30,291 individuals). Bar graphs show age distribution by sex and cohort. BMI = body mass index. (C) After the performance assessment of the fully automated framework, the change in BC measures, distributions, and profiles across age decades were investigated. Age-, sex-, and height-adjusted body composition reference curves were calculated and made publicly available in a web-based z-score calculator (https://circ-ml.github.io).](https://img.auntminnie.com/mindful/smg/workspaces/default/uploads/2026/05/body-comp.XgAjTfPj1W.jpg?auto=format%2Ccompress&fit=crop&h=100&q=70&w=100)


![Overview of the study design. (A) The fully automated deep learning framework was developed to estimate body composition (BC) (defined as subcutaneous adipose tissue [SAT] in liters; visceral adipose tissue [VAT] in liters; skeletal muscle [SM] in liters; SM fat fraction [SMFF] as a percentage; and intramuscular adipose tissue [IMAT] in deciliters) from MRI. The fully automated framework comprised one model (model 1) to quantify different BC measures (SAT, VAT, SM, SMFF, and IMAT) as three-dimensional (3D) measures from whole-body MRI scans. The second model (model 2) was trained to identify standardized anatomic landmarks along the craniocaudal body axis (z coordinate field), which allowed for subdividing the whole-body measures into different subregions typically examined on clinical routine MRI scans (chest, abdomen, and pelvis). (B) BC was quantified from whole-body MRI in over 66,000 individuals from two large population-based cohort studies, the UK Biobank (UKB) (36,317 individuals) and the German National Cohort (NAKO) (30,291 individuals). Bar graphs show age distribution by sex and cohort. BMI = body mass index. (C) After the performance assessment of the fully automated framework, the change in BC measures, distributions, and profiles across age decades were investigated. Age-, sex-, and height-adjusted body composition reference curves were calculated and made publicly available in a web-based z-score calculator (https://circ-ml.github.io).](https://img.auntminnie.com/mindful/smg/workspaces/default/uploads/2026/05/body-comp.XgAjTfPj1W.jpg?auto=format%2Ccompress&dpr=2&fit=crop&h=167&q=70&w=250)


