Dear AuntMinnie Member,
Regulation of artificial intelligence (AI) software for medical use has been in the news lately as the federal government tries to figure out how to manage this new technology. And for the most part, AI users and developers have agreed with the approach proposed by the U.S. Food and Drug Administration (FDA).
That changed this past week, when the FDA issued a proposal that would allow AI software for a number of different medical imaging applications to reach the market without 510(k) regulatory review. The proposal prompted concern among a number of AI proponents, who felt that it could jeopardize trust in AI among both clinicians and patients.
However, it's uncertain whether the proposal will ever be implemented, given this week's turnover in presidential administrations. The proposal was rumored to be the work of Alex Azar, head of the U.S. Department of Health and Human Services, who has already tendered his resignation to the Biden administration.
While you're in our Artificial Intelligence Community, be sure to check out an article on the use of AI in combination with radiomics to predict prostate cancer recurrence, as well as a story on how AI can be used to improve the performance of CT lung cancer screening.
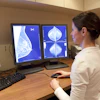
USPSTF reviews breast cancer screening
Every five years or so, the U.S. Preventive Services Task Force (USPSTF) turns its attention to reviewing its breast cancer screening guidelines. And with every review, breast imaging advocates prime themselves for disappointment. This year perhaps is no different.
On Thursday, the USPSTF released the draft research plan that it will use to review its guidance, which since 2009 has failed to recommend that women in their 40s undergo regular breast screening. A review in 2016 saw no changes in that position, despite vociferous lobbying from breast imaging specialists and women's health groups.
Part of the problem is that the USPSTF puts great emphasis on randomized controlled trials (RCTs) in developing its guidelines, and most of the RCTs the group uses to analyze breast screening were conducted decades ago.
In a new wrinkle, the group said it plans to review racial disparities that can affect access to breast screening and clinical outcomes. Stay tuned.
For other articles in the Women's Imaging Community, check out this story on the creation of breast density maps using CT, as well as a story on how ultrasound was used to determine that lymph node enlargement in a small number of cases was due to the COVID-19 vaccine rather than emerging breast cancer.
SalaryScan midpoint
We're at the midpoint in the data collection period for our SalaryScan survey of compensation and benefits in radiology. If you have a few minutes this weekend, please fill out the short survey and let us know about your compensation plans.
We'll combine the data you give us with that of other radiology professionals to update our database and give you the most accurate information on salaries and benefits in radiology. And all responses are totally anonymous.
If you'd like to review data from our SalaryScan survey in 2020, just go to our Jobs page.
![Overview of the study design. (A) The fully automated deep learning framework was developed to estimate body composition (BC) (defined as subcutaneous adipose tissue [SAT] in liters; visceral adipose tissue [VAT] in liters; skeletal muscle [SM] in liters; SM fat fraction [SMFF] as a percentage; and intramuscular adipose tissue [IMAT] in deciliters) from MRI. The fully automated framework comprised one model (model 1) to quantify different BC measures (SAT, VAT, SM, SMFF, and IMAT) as three-dimensional (3D) measures from whole-body MRI scans. The second model (model 2) was trained to identify standardized anatomic landmarks along the craniocaudal body axis (z coordinate field), which allowed for subdividing the whole-body measures into different subregions typically examined on clinical routine MRI scans (chest, abdomen, and pelvis). (B) BC was quantified from whole-body MRI in over 66,000 individuals from two large population-based cohort studies, the UK Biobank (UKB) (36,317 individuals) and the German National Cohort (NAKO) (30,291 individuals). Bar graphs show age distribution by sex and cohort. BMI = body mass index. (C) After the performance assessment of the fully automated framework, the change in BC measures, distributions, and profiles across age decades were investigated. Age-, sex-, and height-adjusted body composition reference curves were calculated and made publicly available in a web-based z-score calculator (https://circ-ml.github.io).](https://img.auntminnie.com/mindful/smg/workspaces/default/uploads/2026/05/body-comp.XgAjTfPj1W.jpg?auto=format%2Ccompress&fit=crop&h=100&q=70&w=100)


![Overview of the study design. (A) The fully automated deep learning framework was developed to estimate body composition (BC) (defined as subcutaneous adipose tissue [SAT] in liters; visceral adipose tissue [VAT] in liters; skeletal muscle [SM] in liters; SM fat fraction [SMFF] as a percentage; and intramuscular adipose tissue [IMAT] in deciliters) from MRI. The fully automated framework comprised one model (model 1) to quantify different BC measures (SAT, VAT, SM, SMFF, and IMAT) as three-dimensional (3D) measures from whole-body MRI scans. The second model (model 2) was trained to identify standardized anatomic landmarks along the craniocaudal body axis (z coordinate field), which allowed for subdividing the whole-body measures into different subregions typically examined on clinical routine MRI scans (chest, abdomen, and pelvis). (B) BC was quantified from whole-body MRI in over 66,000 individuals from two large population-based cohort studies, the UK Biobank (UKB) (36,317 individuals) and the German National Cohort (NAKO) (30,291 individuals). Bar graphs show age distribution by sex and cohort. BMI = body mass index. (C) After the performance assessment of the fully automated framework, the change in BC measures, distributions, and profiles across age decades were investigated. Age-, sex-, and height-adjusted body composition reference curves were calculated and made publicly available in a web-based z-score calculator (https://circ-ml.github.io).](https://img.auntminnie.com/mindful/smg/workspaces/default/uploads/2026/05/body-comp.XgAjTfPj1W.jpg?auto=format%2Ccompress&dpr=2&fit=crop&h=167&q=70&w=250)


