BERLIN - It's easy to complain about the insanity of tracking lung nodule changes in multiple CT scans over time, but at least one group is doing something about it, according to a presentation at the Computer Assisted Radiology and Surgery (CARS) meeting.
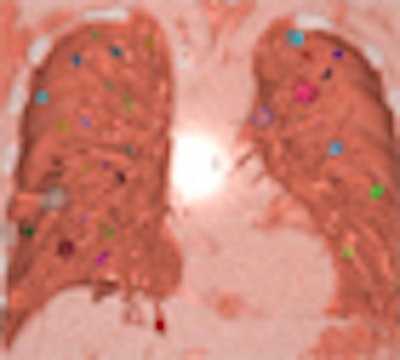
That would be Kensaku Mori, Ph.D., and colleagues from Nagoya University in Nagoya, Japan. By creating and combining algorithms for object detection, classification, measurement, registration, and the like, the researchers have created a rather ambitious computer-aided detection (CAD) scheme that finds, names, measures, and color-codes each nodule, highlighting any changes from previous scans in a rainbow of complementary colors.
At present, the system is not ready for clinical use. Validation studies have yet to begin, the nodule detection algorithm spits out false positives like chewing gum on a hot sidewalk, and three patients hardly make a convincing cohort.
But the "automated analysis and visualization system" fulfills a critical need that other CAD schemes have not, and Mori vowed to have it ready sooner rather than later.
"I think we will have it in clinical use helping our patients in a year or two," he said. And considering that it was his group that built an all-in-one virtual colonoscopy tool, NavI-CAD, in a couple of years, one can imagine it happening.
Many scans, little time
CT chest scans are everywhere these days, used for lung cancer screening, surgical planning, and follow-up of metastases postchemotherapy.
Following the lung lesions of so many patients in three dimensions plus time isn't just a challenge for doctors, but for all CAD systems, which are inevitably "moving to a 4D world," Mori said. The need to automate the follow-up process is critical, considering that some patients (such as those undergoing chemotherapy for lung metastases) undergo follow-up chest CT every couple of months.
The system was created with the aid of methods developed at the Aichi Institute of Technology in Toyota, Japan, and Imperial College London in the U.K., and in collaboration with Sapporo Minami Sanjyo Hospital and Sapporo Kosei General Hospital, both in Sapporo, Japan.
The algorithm allows radiologists to easily monitor follow-up scans based on nonrigid registrations of CT chest images, Mori said. It coregisters follow-up CT scans and finds corresponding nodules that are automatically detected from each CT scan. The results are then displayed using dynamic volume rendering with changing volumes.
A tough job
A particularly vexing challenge at the group's affiliated hospitals are cancer patients with lung metastases, who typically present with multiple inoperable nodules and masses and are treated with chemotherapy. CT is used to monitor treatment response.
"We perform a CT scan every two months, we have to compare each scan, we have to detect lung nodules from the CT dataset, and we have to find the lung nodule correspondence," Mori said. "We are looking at a lot of nodules in difficult cases -- in the worst case we have to look at 200 to 300 lung nodules. Observation is time-consuming, so we need a CAD system."
The system has five main functions: coregistration of CT images of initial and follow-up scans, extraction of lung nodules, correspondence finding of nodules extracted automatically, assignment of a unique identification to each nodule, and dynamic volume rendering of each lung nodule, color-coded to distinguish its acquisition date.
Coregistration
First, the initial and follow-up chest CT scans are coregistered using a nonrigid image registration technique (Rueckert et al, IEEE Transactions on Medical Imaging, August 1999, Vol. 18:8, pp. 712-721). This method consists of rigid registration (affine transformation) followed by free-form deformation.
"If we register everything it's a little difficult, because the lungs are riding on the rib cage," Mori said. Therefore, to avoid interference from outside anatomy, the lung area is extracted prior to registration via thresholding and morphological operations. As a result, only anatomic objects inside the lung area are included in the volume to be registered, not bones, blood vessels, and other organs, Mori said.
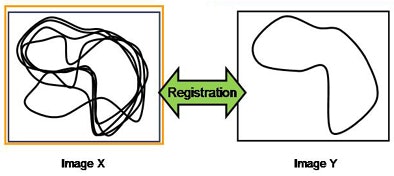 |
| Above, after two sets of extracted lung images are deformed, they can be registered to each other. Bottom, all subsequent chest CT scans are registered to the first set of images. All images courtesy of Kensaku Mori, Ph.D. |
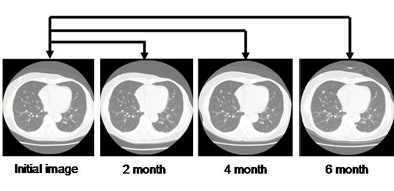 |
Registration precisely aligns the multiple scans of the lungs for further analysis and visualization. All subsequent scans are registered to the initial scan.
To check the registration, it's useful to tile small pieces of images obtained from two acquisitions or two slices of volumes, Mori said. "If it is registered perfectly, you will not see any edges on the chessboard display," he said. "Or you can do a dynamic volume rendering of the coregistered CT scans."
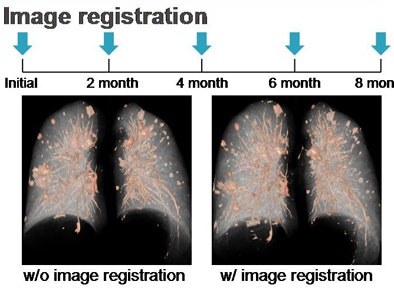 |
| Five sets of CT scans spanning eight months of time are shown without image registration (left) and with image registration (right). |
Nodule detection
"There are a lot of methods for lung nodule detection: filter-based approach, distance-transform approach, and Hessian-matrix-based approach," Mori said. "In our case, we used a local intensity analysis technique which uses a Hessian-based approach. This technique was developed for polyp detection using Hessian eigenvalues" (Oda et al, Proceedings of SPIE, March 17, 2008, Vol. 6915, pp. 69152H-1-10, 2008).
The lung nodules are extracted from each scan. Using the Hessian-based method, bloblike structures are extracted from the CT images to obtain initial candidate regions of lung nodules.
Next, a second-order derivative filter (Min-DD) is applied for false-positive reduction. A level-set method is used to extract blood vessels. Then lung nodule regions are obtained by subtracting blood vessel regions from lung nodule candidate regions. Finally, the lung nodule regions are extracted from the original CT images and transformed onto the coordinate system of the coregistered images.
Correspondence finding is based on the distance between nodules -- matching them up is not a trivial matter in such a highly variable environment, Mori said.
"We need to consider the appearance of new nodules, the disappearance of nodules, also the merger of nodules, and the separation of nodules, so there are a lot of possibilities," Mori said. "We created a function which characterizes the similarity of two nodules."
Of the two main choices, the distance-based approach and the feature-based approach, the group chose the simpler distance-based method. This process first enumerates all of the possible pairs of lung nodules. Introducing cons (list-making) functions, including distance and volume, enables the selection of the best correspondence combination in the dataset. This procedure is iterated until the distance of the nearest correspondence goes below a matching threshold.
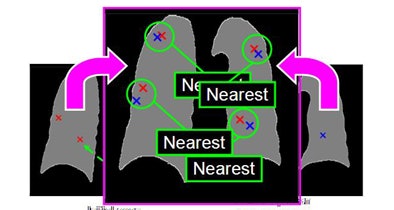 |
| An iterative process enumerates all possible lung nodule combinations from different datasets and selects the best correspondence combination in the CT dataset. |
Unique identifier
A unique ID is assigned to each nodule extracted from CT images, enabling analysis of each nodule and changes by date of acquisition.
Dynamic visualization
Coregistered CT volumes undergo software-based fast volume rendering for dynamic display, Mori said. Changing the volume to be rendered enables animation of the progress of tumor growth, volume reduction, or disappearance.
While reviewing the 3D images "you can see the changes in the nodules using dynamic volumetry," Mori said.
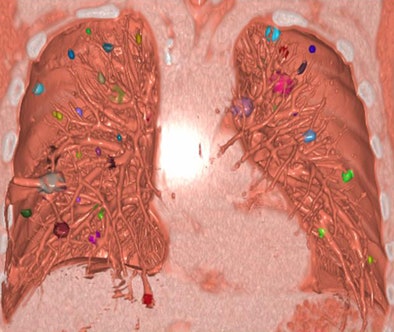 |
| Snapshot of display shows individually identified nodules. Their appearance, growth, merger, or disappearance can be animated and viewed dynamically by periodically changing the volume to be rendered. |
Proof of concept
To date, the method has been applied to three patients with multiple lung metastases, each with as many as five follow-up scans acquired approximately two months apart. Image specifications are 512 x 512 x 185 - 209 voxels and 0.566 x 0.566 x 1.25 mm voxel size.
Each of the patients has more than 50 nodules per volume, and while nodule detection sensitivity of the method is approximately 97% compared to expert readers, one dataset had a total of 52 false-positive nodule detections, so the system still needs tweaking, Mori said. Processing time is about 30 minutes per case. The system has not been tested with the ultra-low-dose scanning techniques that are recommended for patients undergoing multiple follow-ups.
"This kind of CAD is important for chemotherapy assessment," Mori said. "Also, we are trying to move toward 4D CAD: spatial information plus time -- that's quite important in the next generation of CAD. This CAD has image analysis plus display in dynamic rendering."
The group is archiving all of its data in a Google dataset, which will allow researchers to extract it for analysis, he said. In fact, it wouldn't be a bad idea for everyone to archive their image data from childhood on to use it for CAD, Mori said.
"We have developed a lot of 3D image processing algorithms, such as filtering and Hessian-based schemes," Mori said. "But for T, time, there is still no pure 4D algorithm, so we need some good thinking."
By Eric Barnes
AuntMinnie.com staff writer
June 30, 2009
Related Reading
CAD performs well in subsolid pulmonary nodules found with CT, May 15, 2009
Computer-aided system increases detection of early-stage lung cancer, May 4, 2009
All-purpose CAD tool stretches imaging boundaries, July 7, 2008
Hessian matrix-based CAD looks promising for VC, July 2, 2007
VC visualization tool combines advanced features, August 17, 2006
Copyright © 2009 AuntMinnie.com


