Researchers from Germany are mulling the possibility that significantly lower T1 relaxation times may indicate the presence of gadolinium in the brains of patients who have undergone multiple contrast-enhanced MRI scans. Results of their study were published online January 1 in Radiology.
There were no differences in MRI signal intensity between patients who received at least five doses of the macrocyclic gadolinium-based contrast agent (GBCA) gadobutrol (Gadavist, Bayer HealthCare) and controls who had no GBCA exposure; however, there was a significant difference in T1 relaxation times in one particular brain region.
"The reported changes of T1 times in our study might result from retained gadobutrol in the globus pallidus, although the possibly retained amount of gadolinium might be higher than expected. ... As an alternative explanation, the shorter T1 times in the globus pallidus may result from the accumulation of other elements, such as iron," wrote lead author Dr. Marc Saake from University Hospital Erlangen and colleagues.
The prospective study looked at two groups of patients who received only gadobutrol between 2007 and 2017. One group included 76 patients with normal kidney function who underwent at least five (mean, 6.8) gadobutrol-enhanced MRI scans; the second group included 84 patients with impaired renal function who underwent at least one gadobutrol-enhanced MRI exam.
In addition, the researchers created two groups of control subjects: 25 people with normal renal function and 35 people with impaired renal function. None of the controls had ever received a GBCA.
All 220 subjects underwent unenhanced MRI brain scans on a 1.5-tesla MRI scanner (Magnetom Aera, Siemens Healthineers). The protocol included T1-weighted spin-echo and T1 and T2 mapping to determine visual signal-intensity changes; signal-intensity ratios of the globus pallidus to the thalamus and the dentate nucleus to the pons; and T1 and T2 relaxation times. In MRI terms, relaxation refers to how signals can weaken or broaden over time. T1 mapping helps calculate the loss of signal, while T2 mapping conveys broadening of the signal.
The results showed no visual changes or differences in signal-intensity ratios or in T1 and T2 mapping between the patient groups.
However, there were significantly shorter T1 relaxation times in the globus pallidus among patients with normal renal function and multiple administrations of gadobutrol, compared with control subjects with normal renal function. The difference between the two groups was 226.2 msec (p = 0.002).
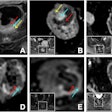
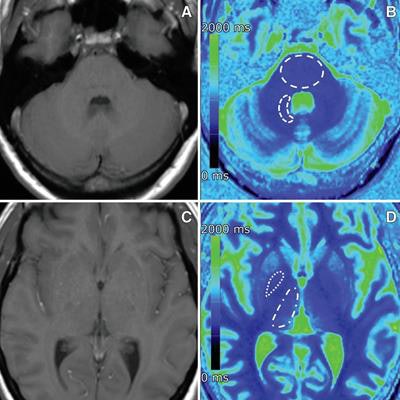
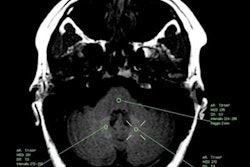
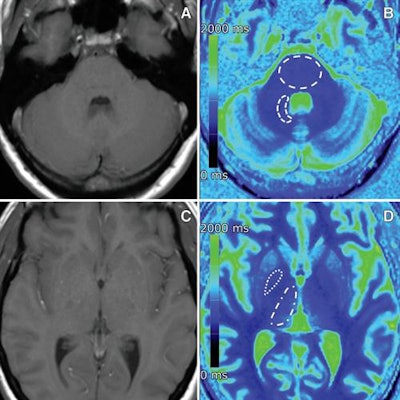 MR images of a 40-year-old woman with osteosarcoma who received 20 single doses of gadobutrol between 2007 and 2017. Transverse native T1-weighted spin-echo MR images (A, C) and corresponding transverse color-coded multiplanar reconstructions (B, D) of T1 maps. Images courtesy of Radiology.
While more research is needed to draw a definitive conclusion between T1 relaxation times and gadolinium deposition, the results "support the concept that patients should be informed about the possibility of subclinical gadobutrol brain retention before undergoing contrast agent-enhanced MRI," the authors wrote.


.fFmgij6Hin.png?auto=compress%2Cformat&fit=crop&h=100&q=70&w=100)

.fFmgij6Hin.png?auto=compress%2Cformat&fit=crop&h=167&q=70&w=250)
