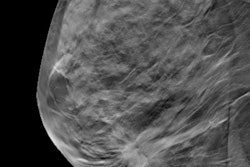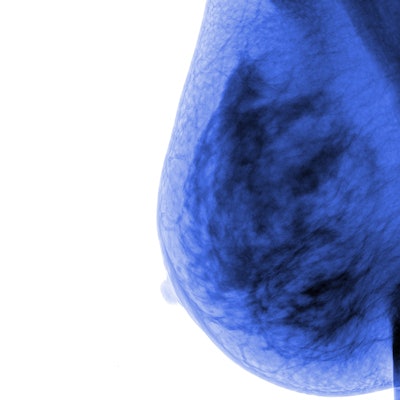
Is age really just a number? Risk scores produced by a deep-learning model based on analysis of mammograms alone may offer better insight into a woman's risk of breast cancer over the next two years than traditional risk factors.
Researchers from Massachusetts General Hospital (MGH) used over 85,000 screening mammograms to develop and validate a deep-learning model for providing two-year risk scores from analysis of screening mammograms. In retrospective testing on mammograms from nearly 7,000 women, the algorithm's risk scores were found to be better indicators of risk than age or mammographic breast density level.
"Our deep-learning model could serve as an important tool for informed decision-making around screening mammography frequency," said Dr. Brian Dontchos of Massachusetts General Hospital in a presentation at the Society of Breast Imaging/American College of Radiology Breast Imaging Symposium.
Due to varying conclusions on the balance between the benefits and harms of screening mammography, there's currently no consensus among medical societies on the age at which women should begin screening and how frequently they should receive it. Tailored screening strategies based on risk factors have generated interest in recent years, but this isn't a new concept; women with BRCA gene mutations, for example, already are advised to begin screening mammography at an earlier age, Dontchos said.
As a result, the researchers sought to develop a deep-learning model to predict a patient's two-year risk of breast cancer based on imaging biomarkers alone. They then wanted to compare this algorithm's performance with traditional risk factors such as a patient's age and mammographic breast density.
For training the risk model, they used 76,568 consecutive screening exams with known two-year outcomes from 2011-2015, while another 9,188 exams from the same period were used for validation. The test set consisted of 22,873 random bilateral screening exams in 6,760 women with no personal history of breast cancer and known two-year outcomes. MGH researchers had previously developed an algorithm to provide five-year breast risk assessments.
In this project, two-year risk scores were classified into three categories: low risk (< 1.67%), intermediate risk (> 1.67% and ≤ 5%), and high risk (> 5%).
The researchers calculated two different types of cancer detection rates from the test set: the number of cancers per 1,000 exams identified within two years of an index screening exam, and the number of cancers per 1,000 exams identified on the subsequent screening exam after the index screening mammogram was categorized as BI-RADS 1 or 2.
There were 259 cancers diagnosed within two years of the index screening exam in the test set. Of these, 132 were identified after a BI-RADS 0 index screening exam and 96 (72.7%) were invasive cancers. The researchers found 17 false-negative index screening exams in this group.
In addition, 95 cancers were detected after a subsequent BI-RADS 0 screening exam and 71 (74.7%) of these were invasive cancers. These cases included four false-negative subsequent screening exams. The remaining 11 cases that were diagnosed were not associated with a true-positive or false-negative mammogram.
When looking at the cancers identified within the two years after an index screening mammography exam, the researchers found that women categorized in the high-risk category had very high cancer detection rates compared with the intermediate- and low-risk groups.
"The risk categories assigned by the deep-learning model were more predictive of breast cancer than age and mammographic density," Dontchos said.
The researchers also found significantly higher cancer detection rates in the intermediate- and high-risk groups for the 95 patients with breast cancer identified after a subsequent BI-RADS 0 screening mammography exam following an initial BI-RADS 1 or 2 index screening exam.
| Detection rate per 1,000 exams for breast cancer identified after subsequent BI-RADS 0 screening mammography exam | ||
| AI low-risk group | AI intermediate- and high-risk groups | |
| Ages 40-49 | 0.5 | 2.2 |
| Ages 50-59 | 0.3 | 7.6 |
| Ages 60-69 | 1.8 | 7.6 |
| Ages 70 and older | 1.2 | 5.8 |
The differences between the low-risk group and intermediate- and high-risk group of patients were statistically significant for all age ranges (p = 0.04, p < 0.01, p = 0.002, and p = 0.07, respectively).


