Dear Advanced Visualization Insider,
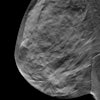
Spiculation in breast lesions means a higher risk of malignancy. Fortunately, spiculation can often be seen unaided on mammography. But these days, as dedicated breast CT emerges as a potent alternative to mammography, radiologists find they have much more image information to sort through than even with full-field digital mammography. As a result, spiculations, and potentially malignant lesions, are easily missed.
Enter researchers from the University of Chicago, who, with support from National Institutes of Health, are building a new breast segmentation feature. The feature works in tandem with other components of breast lesion computer-aided detection (CAD), selecting potentially malignant lesions from the CT data and showing high concordance with biopsy-proven malignancies. Learn more in our Insider Exclusive, brought to you as a subscriber before our other members can access it.
It looks like color is finally coming to image displays in a mainstream way, if a proposed extension to the DICOM Grayscale Standard Display Function (GSDF) is adopted. A recent analysis found that the way color is displayed today is neither adequate nor consistent. The proposed color display function delivered substantial improvements in color linearity over displays calibrated with the current standard. For a peek at the colorful future of radiology, click here.
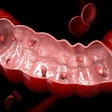
With spectral CT imaging becoming more common, it was only a matter of time before CAD systems started to take advantage of the modality's ability to separate materials in an image better than standard polychromatic imaging can. Researchers from Massachusetts General Hospital considered that it might be especially helpful in minimal-prep CT colonography, where the potential to increase screening compliance is high, but readers are challenged by the need to distinguish colonic polyps from other materials in the colon. Find out how they did it here.
Also in CAD, researchers have long wanted a simple and automated way to find and label lymph nodes in the mediastinum to facilitate many kinds of diagnosis. Now, a group from the National Institutes of Health has done it with an automated system that first segments the organs and then detects and maps the lymph nodes. How well did it work? Click here to find out.
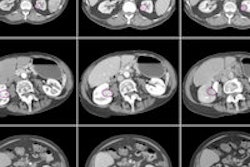
Finally, texture analysis is making a name for itself in cancer imaging, and in a study presented at the 2014 RSNA meeting, the process was applied to the task of sorting kidney lesions, which are notoriously difficult to triage from CT images. Is it renal cell carcinoma or an oncocytoma? Texture analysis offers solid clues by analyzing heterogeneity. Get the details in a story you'll find here.
Be sure to scroll through the links below for the rest of the news in your Advanced Visualization Community.
