A deep-learning algorithm can enable accurate staging of chronic obstructive pulmonary disease (COPD), as well as predictions on five-year progression and mortality, according to research published online April 8 in Radiology: Cardiothoracic Imaging.
A multi-institutional team utilized deformable image registration techniques and a deep-learning segmentation algorithm to automate quantification of emphysema and air trapping on inspiratory and expiratory CT images. These features were then used to develop a CT-based COPD staging system that parallels the spirometrically defined Global Initiative for Chronic Obstructive Lung Disease (GOLD) stages. In testing on nearly 9,000 patients, these CT-derived COPD severity stages -- independently or in conjunction with the GOLD criteria -- showed strong performance for predicting disease progression and mortality.
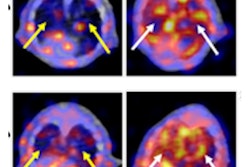
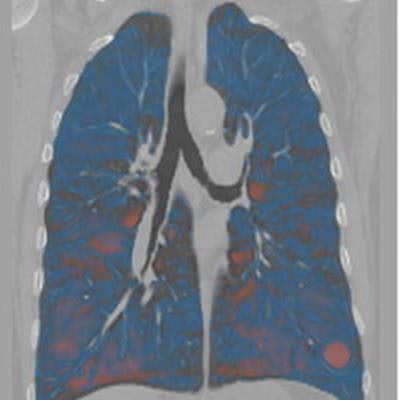
![Visualization of lung involvement using attenuation difference maps and emphysema. (A) Image in a 66-year-old man with a 35-pack-year smoking history (Global Initiative for Chronic Obstructive Lung Disease [GOLD] stage 4, forced expiratory volume in 1 second [FEV1] = 23.8% predicted; FEV1/forced vital capacity [FVC] ratio = 0.32). (B) Image in a 61-year-old man with a 40-pack-year smoking history (GOLD stage 4, FEV1 = 12.9% predicted, FEV1/FVC ratio = 0.29). (C) Image in a 78-year-old man with a 65.8-pack-year smoking history and chronic bronchitis (GOLD stage 2, FEV1 = 59.6% predicted, FEV1/FVC ratio = 0.47). (D) Image in a 48-year-old man with a 26-pack-year smoking history (GOLD stage 0, FEV1 = 92.9% predicted, FEV1/FVC ratio = 0.82). %AT = percentage air trapping, %EM = percentage emphysema, %TLI = percentage total lung involvement. Images and caption courtesy of the RSNA.](https://img.auntminnie.com/files/base/smg/all/image/2021/04/am.2021_04_08_20_08_7445_2021_04_09_AI_COPD.png?auto=format%2Ccompress&fit=max&q=70&w=400) Visualization of lung involvement using attenuation difference maps and emphysema. (A) Image in a 66-year-old man with a 35-pack-year smoking history (Global Initiative for Chronic Obstructive Lung Disease [GOLD] stage 4, forced expiratory volume in 1 second [FEV1] = 23.8% predicted; FEV1/forced vital capacity [FVC] ratio = 0.32). (B) Image in a 61-year-old man with a 40-pack-year smoking history (GOLD stage 4, FEV1 = 12.9% predicted, FEV1/FVC ratio = 0.29). (C) Image in a 78-year-old man with a 65.8-pack-year smoking history and chronic bronchitis (GOLD stage 2, FEV1 = 59.6% predicted, FEV1/FVC ratio = 0.47). (D) Image in a 48-year-old man with a 26-pack-year smoking history (GOLD stage 0, FEV1 = 92.9% predicted, FEV1/FVC ratio = 0.82). %AT = percentage air trapping, %EM = percentage emphysema, %TLI = percentage total lung involvement. Images and caption courtesy of the RSNA.
Visualization of lung involvement using attenuation difference maps and emphysema. (A) Image in a 66-year-old man with a 35-pack-year smoking history (Global Initiative for Chronic Obstructive Lung Disease [GOLD] stage 4, forced expiratory volume in 1 second [FEV1] = 23.8% predicted; FEV1/forced vital capacity [FVC] ratio = 0.32). (B) Image in a 61-year-old man with a 40-pack-year smoking history (GOLD stage 4, FEV1 = 12.9% predicted, FEV1/FVC ratio = 0.29). (C) Image in a 78-year-old man with a 65.8-pack-year smoking history and chronic bronchitis (GOLD stage 2, FEV1 = 59.6% predicted, FEV1/FVC ratio = 0.47). (D) Image in a 48-year-old man with a 26-pack-year smoking history (GOLD stage 0, FEV1 = 92.9% predicted, FEV1/FVC ratio = 0.82). %AT = percentage air trapping, %EM = percentage emphysema, %TLI = percentage total lung involvement. Images and caption courtesy of the RSNA."Most notably, we found that patients with moderate spirometric impairment and moderate-to-severe disease at CT had the highest likelihood of progression," wrote Kyle Hasenstab, PhD, of the University of California, San Diego and colleagues. "These results point to the synergistic value of CT and functional testing to identify patients at highest risk of progression and to potentially identify those who might derive the greatest benefit from medical or behavioral intervention to address ongoing tobacco exposure or other inhalational exposures."
After training a convolutional neural network using 1,037 volumetric CT series from 888 current or former smokers, they found that the combination of deformable coregistration and their algorithm yielded reliable automated quantification of emphysema and air trapping. Measurements of low-attenuating areas had an intraclass correlation of more than 0.99 in comparison with third-party image analyses.
The researchers then created a CT-based staging system by applying their technique to 8,951 patients from the COPD Genetic Epidemiology Study. Bivariable thresholds for the emphysema and air trapping measurements were calculated to determine four CT COPD severity stages: mild, moderate, severe, and very severe. This method was able to predict the GOLD stage with an area under the curve (AUC) ranging from 0.86 to 0.96.
Next, the researchers performed logistic regression analysis to predict disease progression and mortality over five years. They found that the automated CT algorithm facilitated staging of COPD severity and yielded comparable diagnostic performance to the GOLD criteria.
| Performance of AI-derived CT COPD stages for predicting five‑year progression and mortality | |||||
| Normal | Mild | Moderate | Severe | Very severe | |
| Odds ratio for disease progression | 1 | 1.07 | 1.50 | 2.88 | 2.67 |
| Hazard ratio for mortality | 1 | 0.83 | 0.82 | 1.11 | 2.23 |
Even better results were achieved when the CT severity results used in combination with GOLD staging, especially for patients with GOLD stage 2 disease and severe or very severe disease at CT. Those patients had an odds ratio of 4.48 and 4.72, respectively, for disease progression.
"Fully automated deep-learning algorithms can facilitate translation of the proposed stages into clinical practice, potentially allowing us to provide better care for patients with COPD," the researchers wrote.
These types of algorithms could facilitate inclusion of quantitative information on the extent of emphysema, air trapping, bronchial wall thickening, and CT-based COPD staging in chest CT reports in COPD patients, noted Dr. Mannudeep Kalra and Dr. Shadi Ebrahimian of Massachusetts General Hospital in an accompanying commentary.
"We hope that [deep-learning] algorithms can reduce or avoid the burden of manual image processing and incorporation of quantitative information into radiology report text," Kalra and Ebrahimian wrote. "The promising array of [deep-learning] algorithms can help optimize treatment strategies with a better classification of imaging and spirometry-based disease staging, severity, and prognostication."


