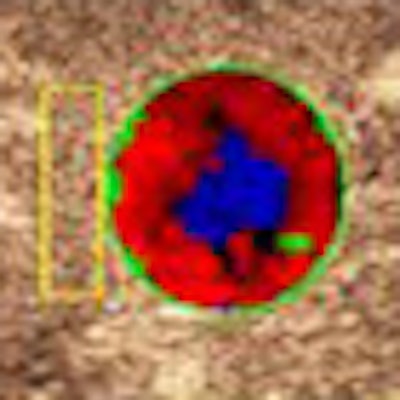
Swiss researchers have developed a real-time parametric imaging technique for distinguishing benign from malignant liver lesions easily and noninvasively using contrast-enhanced ultrasound. In its first clinical run, the method delivered high sensitivity and specificity in a patient cohort.
Distinguishing benign from malignant focal liver lesions noninvasively using ultrasound is a key research goal, and is considered the most promising potential use of contrast-enhanced ultrasound.
"It may be possible to characterize a lesion by looking at its contrast uptake compared to its surrounding normal parenchyma," said Nicolas Rognin, PhD, from Bracco Research in Geneva. Rognin spoke in a presentation at the June 2010 Computer Assisted Radiology and Surgery (CARS) meeting, also in Geneva.
After a bolus contrast injection, the characterization of liver lesions can be guided by the known dynamic vascular patterns (DVP) of the lesions with respect to the surrounding healthy parenchyma. Following linearization of video signals that record contrast uptake in the liver, contrast uptake kinetics can be expressed in echo-power units as a function of time, he said.
"There are two type of lesions, benign or malignant, each one separated into two classes," Rognin said. "In the example of hepatocellular carcinoma, its DVP shows strong enhancement in the arterial phase compared to the surrounding healthy parenchyma, followed by a washout in the portal phase, and it becomes strongly hypoenhanced in the late phase."
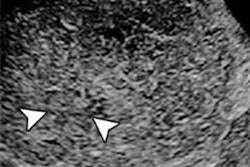
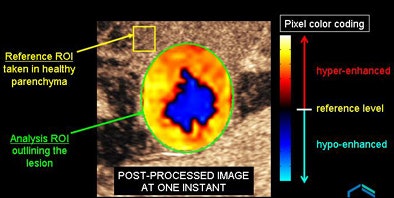
To render these grayscale differences more conspicuous, the researchers previously developed an image processing technique to enhance these DVP sequences in postprocessed images, Rognin said. Their method "demonstrated usefulness in aiding lesion characterization," he said, but it was limited to characterizing a single image at a single moment in time.
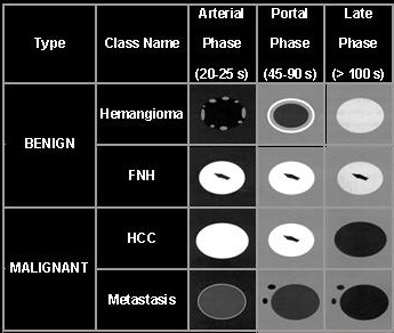 |
| Above, analysis of DVP in ultrasound can be used to distinguish benign from malignant flow patterns in focal liver lesions (FNH = focal nodular hyperplasia, HCC = hepatocellular carcinoma). Below, a previous study by the group rendered the DVP differences more conspicuous with the use of an image postprocessing method that characterized the flow patterns by color. However, this method was limited to depicting a single image at a single point in time. All images © Bracco Switzerland 2010. |
 |
In the current study, "the objective is to provide all the relevant clinical information in a single image," a feat accomplished by "applying pixel classification to map dynamic vascular signatures into a parametric image," he said.
The dynamic parametric mapping technique consists of four main steps:
- Preprocessing: Video data are spatially transformed to compensate for any in-plane motion, and then linearized to derive echo-power signals at the pixel level.
- Signal smoothing: Echo-power signals are then smoothed using a curve-fitting technique with a bolus perfusion model function.
- Signal subtraction: The "difference" signals are calculated by subtracting the reference signal from the smoothed echo-power signals.
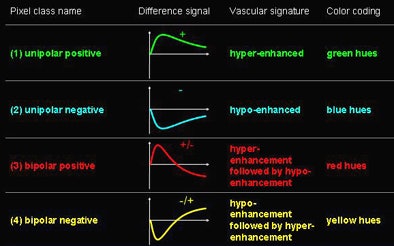
- Pixel classification: Pixels are categorized into four classes according to the polarity of their difference signals over time.
Using contrast-enhanced ultrasound, benign "hemangiomas are typically hyperenhanced at all times, while [malignant] hypervascular metastases usually present hyperenhancement during the arterial phase followed by a hypoenhancement in the portal-venous phase," Rognin said. "The 'difference' signal in the hemangioma exhibits a unipolar vascular signature, whereas the hypervascular metastasis difference signal has a bipolar vascular signature."
The pixel classification scheme used green hues to represent unipolar positives (permanent hyperenhanced signature). Blue hues depicted unipolar negatives (permanent hypoenhanced signature), while red hues represented bipolar positives (hyperenhancement, followed by hypoenhancement signature) and yellow hues depicted bipolar negatives (hypoenhancement, followed by hyperenhancement signature).
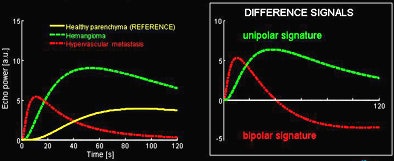 |
| Hemangiomas (benign) are typically hyperenhanced at all times, while hypervascular metastases (malignant) usually present a hyperenhancement during the arterial phase, followed by a hypoenhancement in the portal-venous phase. Color coding of benign or malignant lesion types is performed by analyzing the "difference" signals, which are determined by subtracting the reference signal from the smoothed echo-power signals in the ultrasound image. The difference signal in the hemangioma exhibits a unipolar vascular signature, whereas the hypervascular metastasis difference signal has a bipolar vascular signature. In the table below, vascular signatures are categorized into four classes according to the polarities of their corresponding difference signals over time. Different color hues are used for displaying pixels in different classes. |
|
|
Thus, malignant lesions appear as red areas, leaving benign lesions colored green or yellow. Once analyzed, the contrast sequence analyses can then be synthesized as spatial maps of vascular signatures that can be used to determine the lesion type, Rognin said.
For this, the researchers subjected their DVP parametric imaging technique to clinical assessment that included 146 focal liver lesions (113 malignant and 33 benign), imaged with real-time low-mechanical index (MI) contrast-specific ultrasound after a bolus injection of 2.4 mL of a microbubble contrast agent (SonoVue, Bracco, Milan).
To verify the findings, a reference diagnosis was provided in each case by CT, MRI, or biopsy.
The lesions were scanned using low-MI real-time contrast ultrasound on one of several scanners, including HDI 5000 and iU22 (Philips Healthcare, Andover, MA), SSD-5500 (Aloka, Tokyo), or Sequoia 512 (Siemens Healthcare, Erlangen, Germany).
The DVP parametric images were read by a clinician blinded to the results using the presence of red coloration as a criterion of malignancy. The method yielded 97% sensitivity and 91% specificity for malignancy.
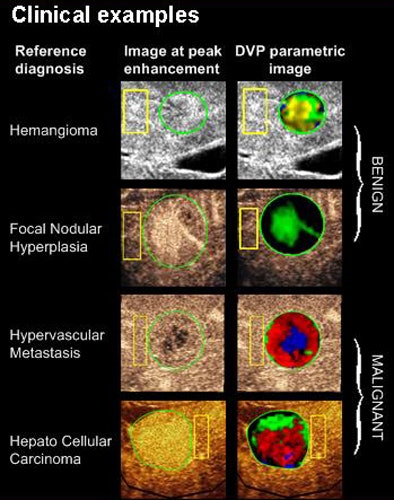 |
| Four clinical cases show how DVP parametric images allow facilitated lesion characterization as benign or malignant in four typical clinical examples, with malignant lesions appearing in red, unlike benign lesions which are green or yellow-green in appearance. |
In comparison, a multicenter study of contrast-enhanced ultrasound that did not employ a mapping method delivered 91% sensitivity and 86% specificity, Rognin said (American Journal of Roentgenology, June 2006, Vol. 186:6, pp. 1551-1559).
"The high efficacy scores obtained with DVP parametric imaging demonstrate the potential of the method for increasing confidence in characterizing focal liver lesions," Rognin said, noting that the results compared favorably with the literature.
In addition to providing an interpretation method that was as simple as looking for red areas as an indicator of malignancy, the technique has the advantage of being less time-consuming than the usual method of reviewing entire sequences of contrast images, Rognin said. It can be performed in about two minutes per case.
The researchers plan to study automated segmentation of normal parenchyma as a way to reduce operator-dependent variability in the resulting parametric maps, thus approaching true computer-aided diagnosis of focal liver lesions on contrast ultrasound, Rognin said.
"In the future, 4D contrast imaging is likely to become more prevalent," he said. "The review of such sequences could become rather tedious, so the extension of DVP parametric imaging to volumetric data may represent a very valuable tool for clinicians."
The researchers also plan to evaluate their technique more broadly in the clinical setting using a larger group of patients.
By Eric Barnes
AuntMinnie.com staff writer
July 30, 2010
Related Reading
HIFU for liver, pancreatic cancer has high complication rate, July 12, 2010
Radioactive microspheres help some with colorectal cancer metastases, July 9, 2010
Yttrium-90 microspheres prolong survival with advanced liver cancer, March 18, 2010
Chemoembolization, yttrium give similar results against advanced liver cancer, February 2, 2010
CT speeds antiangiogenesis therapy assessment, June 14, 2010
Copyright © 2010 AuntMinnie.com
