As quantitative imaging becomes increasingly important in radiology, automated tools such as computer-aided detection (CAD) software could play a vital role. A team from the U.S. National Institutes of Health (NIH) has found that automated liver volumetry may help improve the detection of hepatomegaly, or abnormal liver enlargement.
By taking automated liver volume measurements provided from their CAD software and normalizing them by the patient's body surface area to create a hepatomegaly score (H-score), the researchers found that their method could aid in identifying and grading hepatomegaly. It may also yield improvements over manual techniques commonly used in current clinical practice.
"The H-score, in association with automated liver volumetry, may improve the accuracy and efficiency of identification of patients with hepatomegaly," said Dr. Ronald Summers, PhD, senior investigator in the NIH's department of radiology.
Summers presented the results during a scientific session at the recent American Roentgen Ray Society (ARRS) annual meeting in Vancouver. The study was also recently published in Academic Radiology (May 2012, Vol. 19:5, pp. 588-598). Marius Linguraru was the first author on the study.
Radiologists typically provide qualitative descriptions of abnormalities in the abdomen on CT and MRI scans. Interested in developing the quantitative radiology report of the future, however, Summers told AuntMinnie.com that the routine measurement of liver volume and accurate distinction of normal and abnormal liver volumes are essential steps in this direction.
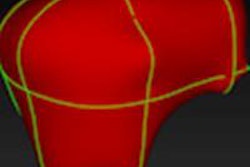
With that goal in mind, the NIH researchers have developed a CAD tool in which the fully automated software locates the liver edge in each image slice in which the liver appears; an atlas of manually traced livers from a group of other patients is then used to estimate the liver shape and location.
"The liver estimation is then improved through a series of optimizations that find the edge of the liver more accurately," he said.
Nomograms were defined by analyzing the distribution of liver volumes that had been normalized by patient body surface area (H-score) of normal patients who had undergone abdominal CT scanning prior to donating their kidneys. The average volume of normal livers was approximately 1.5 ± 0.3 L.
The nomograms defined mild hepatomegaly as greater than 1 standard deviation from the average, while massive hepatomegaly was defined as greater than 2.5 times the standard deviation.
The team tested their method in a retrospective study involving 148 abdominal contrast-enhanced clinical CT studies, including 77 normal and 71 hepatomegaly cases. All cases were reinterpreted by two experienced radiologists, who diagnosed hepatomegaly cases via visual inspection or by linear liver height measurements. The researchers then created consensus radiology reports based on the reinterpretations and the original interpretation.
After the liver volumes were measured by the CAD tool, the researchers calculated volume overlaps and volume errors compared to manual methods. The H-score was then used as a reference standard to retrospectively evaluate the performance of radiologists in diagnosing hepatomegaly.
The team found that the software's automated segmentation capability performed well, yielding volume overlap of 96.2% and volume error of 2.2%. No significant differences were found between manual and automated segmentation techniques.
Compared with the H-score as the reference standard, the commonly used method of manually measuring the liver's height at the midhepatic line (MHL) on images did not fare as well as the radiologists (as determined from consensus reports).
CAD sensitivity, specificity in detecting hepatomegaly
|
|||||||||||||||||||||||||||
The sensitivity improvements over midhepatic line measurements for both massive hepatomegaly (p = 0.006) and all hepatomegaly cases (p = 0.007) were statistically significant.
If the consensus radiology reports had been used as the reference standard in the study, H-scores would have yielded 97.6% sensitivity and 86.4% specificity for detecting hepatomegaly, with an area under the receiver operator characteristics (ROC) curve of 0.98.


