Sometimes seeing is believing. An imaging artificial intelligence (AI) algorithm that can show why it made its diagnosis can go a long way toward building radiologist confidence in its findings, according to a scientific presentation at the recent RSNA 2017 meeting in Chicago.
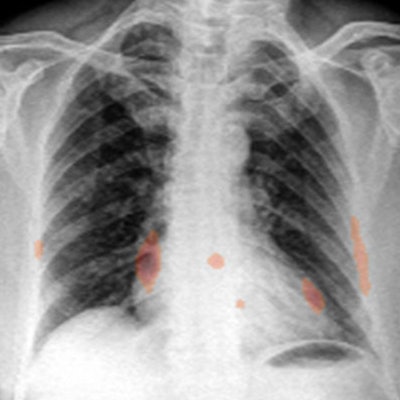
Researchers from Columbia Asia Radiology Group and imaging AI software developer Qure.ai have developed a deep-learning algorithm that can yield high performance in detecting 14 specific abnormalities on chest x-rays. What's more, users can see how the algorithm arrived at its diagnosis by viewing explanatory "heat maps" that highlight the important regions of the image, according to presenter Dr. Shalini Govil from Columbia Asia Radiology Group in Bangalore, India.
"It has the potential to markedly improve radiologist productivity and consign the albatross of 'unreported chest x-rays' to the annals of history," she said. "The algorithm can also serve as a means of triage and bring radiographs with critical findings to the top of the reporting pile. Perhaps, in the future, when confidence in machine diagnosis is high, these algorithms could be used in quality control to detect errors or help adjudicate radiology report discrepancies."
An unmet need
The use of chest radiography continues to grow. Unfortunately, the number of healthcare professionals available to reliably report chest radiographs isn't increasing in tandem, Govil said.
"This is partly due to the waning interest in x-ray reporting among radiologists and a lack of adequate training among physicians in the wards, emergency department, and intensive care unit," she told AuntMinnie.com. "X-ray interpretation is also notoriously difficult with high false-negative rates and interobserver variability."
There are huge backlogs in chest x-ray reporting around the world, even in countries such as the U.K. and Australia, Govil said.
"And in some countries, nobody looks at that chest x-ray except perhaps a very junior or clinical person in the [emergency room] or [intensive care unit], which can be quite dangerous," she said.
Deep learning
To address this challenge, Columbia Asia Radiology Group partnered with Qure.ai to evaluate a deep-learning algorithm for diagnosing radiographs. The 18-layer convolutional neural network (CNN) was trained, validated, and tested using 210,000 chest x-ray images and reports provided by 11 Columbia Asia hospitals in India. Of the 210,000 cases, 72% were used for training and 18% were used for validation of the algorithm. The remaining 10% were set aside for testing.
Prior to use by the CNN, the images were normalized and scaled to a standard size. Natural language processing was used to extract key words from the reports for abnormalities. The CNN was then trained to detect the presence or absence of every abnormality. In the validation phase, the algorithm was retrained using backpropagation and other deep-learning methods such as cross-entropy loss, Govil said.
The CNN uses single-abnormality models to detect the presence or absence of a specific abnormality, such as pleural effusion. Other models assessed for consolidation, cardiomegaly, emphysema, atelectasis, cavity, prominent hilum, tracheal shift, reticulonodular pattern, blunted costophrenic (CP) angle, fibrosis, and opacity.
After the algorithm was applied to the testing cases, receiver operating characteristic (ROC) analysis showed that it produced an area under the curve (AUC) that ranged from good to excellent for identifying abnormal versus normal cases, as well as for finding specific abnormalities, according to Govil.
| Algorithm performance for common chest x-ray abnormalities | |||
| Sensitivity | Specificity | AUC | |
| Abnormal | 83% | 72% | 0.84 |
| Tracheal shift | 91% | 93% | 0.98 |
| Emphysema | 85% | 88% | 0.95 |
| Pleural effusion | 88% | 85% | 0.95 |
| Cardiomegaly | 89% | 85% | 0.94 |
| Prominent hilum | 85% | 87% | 0.93 |
| Cavity | 87% | 84% | 0.92 |
| Consolidation | 85% | 87% | 0.92 |
| Blunted CP angle | 85% | 85% | 0.92 |
| Fibrosis | 85% | 75% | 0.90 |
| Reticulonodular pattern | 85% | 77% | 0.90 |
| Opacity | 85% | 77% | 0.89 |
| Calcification | 85% | 72% | 0.87 |
| Atelectasis | 85% | 74% | 0.86 |
| Pulmonary edema | 85% | 65% | 0.84 |
An AUC of 0.90 to 1.0 is considered excellent, while an AUC of 0.80 to 0.90 is considered good, she said.
"This was really amazing to me to see that the machine had done this all by itself," she said. "Up to this point in our project, there [had] really been no human involvement."
The algorithm's performance compared favorably with the performance of other similar algorithms published in the literature, Govil said.
Heat maps
The researchers believe that the algorithm's clinical utility is enhanced by its ability to generate heat maps.
"[These heat maps] have literally allowed us to see through the algorithm's 'eyes,' " Govil said.
The algorithm can generate heat maps using two methods: occlusion visualization and integrated gradients. The occlusion visualization technique color codes an image patch that is considered to be the most significant abnormality on the image, while the integrated gradients method accounts for the sensitivity of each pixel prediction and obtains an approximate attribution score for each pixel.
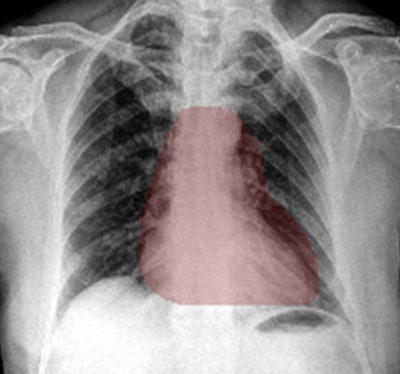 Heat maps generated by chest x-ray AI software. The occlusion-visualization heat map method (above) color codes the image patch that is considered to be the most significant abnormality on the image. The integrated gradients heat map method (below) accounts for the sensitivity of each pixel for predicting an abnormality and obtains an approximate attribution score for each pixel. It then generates a sensitivity heat map. Images courtesy of Dr. Shalini Govil.
These heat maps can help win over doctors who may be skeptical about the benefits of deep learning and AI, according to Govil.
"If you show them the heat maps, there's an immediate confidence that it is looking at what we are looking at," she said.
Heat maps can provide clinical users and those who are validating AI algorithms with visual cues that could make it easier to accept or reject a deep learning-based chest x-ray diagnosis, Govil said. In addition to raising confidence in the machine's ability to analyze complexity, heat maps could also potentially be a means of providing feedback to the trainee computer.
"The human trainer or the teacher [could correct] that heat map, as one does with a resident when they're pointing to the wrong thing on the image," Govil said. "If we can edit the points of the heat map, perhaps [we can] feed [that information] back [to the computer] and see if it makes a difference. Or perhaps it will learn to self-correct its own heat maps."
Much potential
The researchers see a lot of potential for the algorithm for facilitating preliminary reports of chest x-rays before clinical decisions are made, for improving interpretation accuracy, for triaging cases that need immediate attention, for clearing large x-ray backlogs, for quality control, and for radiology resident training, Govil said.
Some questions remain, however, regarding the use of AI in imaging applications, Govil said. Are small, focused datasets better for training? Should multiple CNNs be used? Is it important to perfect the training dataset with expert reviews? Should more feedback be provided to the training algorithm? And does repeating the same image achieve the same result?
"Heat maps and other tools that reveal the way the algorithm is actually thinking may be the game changer that will help us answer these questions," Govil said.


