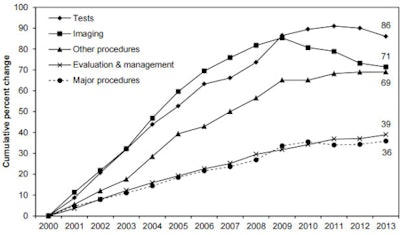
Advocates for radiology are criticizing new data from the Medicare Payment Advisory Commission (MedPAC) that show growth in medical imaging from 2000 to 2012. In fact, the data indicate that imaging utilization has been declining since 2009.
Imaging advocates say MedPAC's annual data book released in July paints an inaccurate picture of the specialty and its contribution to healthcare costs, which distracts from the real questions about healthcare waste.
 Dr. Richard Duszak.
"In this year's report, MedPAC states that 'the number of CT and MRI scans per 1,000 fee-for-service beneficiaries grew rapidly from 2000 to 2012,' " wrote Dr. Richard Duszak in a commentary published by the Harvey L. Neiman Health Policy Institute. "Their not-so-subtle narrative is this: Imaging has been growing out of control for over a decade, and things aren't getting any better."
But MedPAC's graphs to support this conclusion aren't accurate, according to Duszak: In fact, although imaging use grew dramatically between 2000 and 2012, growth since then has stabilized.
"[The graph conceals] 11 years of intervening data with important policy implications," he said.
 Source: MedPAC analysis of claims data for 100% of Medicare beneficiaries.
Big book
MedPAC's annual data gather information on spending nationwide and within the Medicare program, and it also includes data on beneficiary demographics, quality of care in the program, and beneficiary and other payor liability. In this year's document, MedPAC found that imaging contributed to the bulk of low-value care in 2012. The group cited back imaging for nonspecific low back pain and screening for carotid artery disease in asymptomatic patients in the category for this statistic.
"Imaging and cancer screening measures accounted for most of the volume of low-value care in 2012: about 70% of the instances of low-value care per 100 beneficiaries," MedPAC wrote. "Because we used claims data to measure low-value care, our analysis likely represents a conservative estimate of the amount of low-value care in Medicare."
The report also stated that about one-third of Medicare spending for imaging under the fee schedule in 2013 was for CT and MRI studies, while about a quarter was for various types of ultrasound.
Medicare and beneficiaries spent a total of $9.6 billion for imaging services under the fee schedule that year, a 3.2% decline from $9.9 billion in 2012. MedPAC attributed the decline to a 1% drop in the number and complexity of imaging services per beneficiary in 2013, and the adoption by the U.S. Centers for Medicare and Medicaid Services of more current practice-expense data, as well as its update of the interest rate assumption for imaging equipment.
| 2013 Medicare spending for imaging services by modality | |
| Modality | Percent Medicare spending under fee schedule |
| CT | 18% |
| Echocardiography | 9% |
| Imaging procedures (stereoscopic x-ray guidance for radiation therapy, fluoroguide for spinal injection, other interventional procedures) | 6% |
| MR | 14% |
| Nuclear medicine | 7% |
| PET | 5% |
| Standard imaging (chest, musculoskeletal, mammography) | 23% |
| Ultrasound | 18% |
Focusing on CT and MR, the report found that the number of these scans per 1,000 fee-for-service beneficiaries grew rapidly from 2000 to 2012, although there was little change between 2012 to 2013. CT scans of parts of the body other than the head more than doubled from 2000 to 2013, from 185 per 1,000 beneficiaries to 399, MedPAC wrote.
Lost years?
But MedPAC's data don't tell the whole story, according to Duszak. He included the following in his commentary, gathered by Neiman researchers, which show CT and MRI scans per 1,000 Medicare beneficiaries peaking for CT in 2008 and for MRI in 2006, and falling since then.
| Medicare CT and MR procedures per 1,000 beneficiaries |
||
| Year | CT | MR |
| 2004 | 433 | 144 |
| 2005 | 453 | 149 |
| 2006 | 479 | 157 |
| 2007 | 495 | 155 |
| 2008 | 508 | 153 |
| 2009 | 501 | 145 |
| 2010 | 488 | 139 |
| 2011 | 403 | 140 |
| 2012 | 405 | 139 |
| 2013 | 403 | 135 |
"Yes, imaging utilization is up from 2000," Duszak wrote. "But it peaked several years ago, and is now holding stable (CT) or continuing to decline (MR). [And this] downturn, by the way, is not news. In fact, it was the focus of our very first policy brief when we launched the Neiman Health Policy Institute three years ago."
There are questions that MedPAC's data do not address, such as why per beneficiary Medicare use is more than five times higher in Florida than Ohio, according to Duszak.
"We need data tools like this to ask such questions -- and then seek meaningful answers," he wrote. "If MedPAC's report is concealing important information about radiology, what else is it concealing about other physicians, hospitals, payors, and patients?"


