After a period of rapid increases in the first half of the decade, growth in diagnostic imaging utilization finally appears to be slowing in the U.S., according to a survey of Medicare databases that was presented at last week's 2010 RSNA meeting in Chicago.
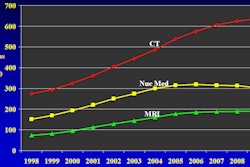
A research team from Thomas Jefferson University in Philadelphia reported that utilization of noninvasive diagnostic imaging in the Medicare population grew at a compound annual growth rate (CAGR) of 1.4% between 2005 and 2008, well down from the 4.1% CAGR experienced between 1998 and 2005.
"There has been a dramatic slowdown in growth of noninvasive diagnostic imaging since 2005," said presenter David C. Levin, MD. "It affects all modalities but is particularly pronounced in nuclear medicine and MRI. It's also especially pronounced among outpatients."
Perhaps not surprisingly, nonradiologist physicians continue to outpace radiologists in imaging utilization.
"After 2005, growth slowed among both radiologists and nonradiologists, but in both time periods [1998-2005 and 2005-2008], growth in utilization rates was twice as rapid among nonradiologist self-referring physicians as among radiologists," he said.
In a presentation at a meeting of the Medicare Payment Advisory Commission (MedPAC) in 2008, imaging was shown to be growing at the most rapid rate of all physician services in the Medicare program between 2000 and 2006. This data, along with other research showing similar findings, attracted the attention of payors and policymakers, Levin said.
"One of the results of this was the efforts to reduce the reimbursements for imaging," he said. "They saw that imaging was growing very rapidly and the costs were growing. And so, therefore, they thought that they'd better reduce the reimbursements they were paying. This [reimbursement cutting] is perhaps the root of a lot of our problems."
The researchers sought to determine if the high growth rate seen earlier in the decade for noninvasive diagnostic imaging services was continuing. Using the U.S. Centers for Medicare and Medicaid Services (CMS) Part B Physician/Supplier Procedure Summary Master Files from 1998 to 2008, the authors identified all CPT codes for discretionary noninvasive diagnostic imaging (procedures that involved the discretion of the ordering physician).
Interventional procedures and imaging for radiation therapy planning were not included in the study, as they were judged to be more or less mandated by the clinical condition of the patient, Levin said.
The researchers obtained procedure volume data for each code and calculated overall utilization rates per 1,000 Medicare fee-for-service beneficiaries, and they also tabulated usage rates by modality. Using Medicare's physician specialty codes, the study team also broke out utilization rates for radiologists and all nonradiologists as a group. They then studied trends.
After generating a CAGR of 4.1% between 1998 and 2005, imaging procedure utilization rates trailed off to a CAGR of 1.4% between 2005 and 2008.
"There was a dramatic flattening in the rapid growth trend in noninvasive diagnostic imaging," Levin said.
Even after the reduction in the growth curve, utilization growth remained twice as rapid among nonradiologists as it was for radiologists, however.
Growth in imaging utilization (CAGR)
|
In 2008, the total utilization rate of discretionary noninvasive diagnostic imaging in the Medicare fee-for-service population was 4,404 exams per 1,000 beneficiaries, including 2,740 exams among radiologists and 1,515 exams among nonradiologist physicians. These figures also include independent diagnostic testing facilities (IDTFs).
By modality, MRI experienced a flattening in its overall growth, while nuclear medicine (including PET) actually had a slight drop in utilization rates. CT utilization rates were impacted significantly by the modality's growing use in the emergency department (ED). If ED utilization was subtracted from the overall CT utilization, however, a flattening trend does become evident, Levin said.
Slowing growth was also experienced in echocardiography and all noncardiac ultrasound. "There was some flattening, [although] it wasn't as pronounced as any other modalities," he said.
For x-ray (including mammography), there was essentially no growth in utilization, Levin said. Slower growth was also particularly evident in outpatient advanced imaging.
Growth in outpatient advanced imaging (CAGR)
|
While some have pointed to the Deficit Reduction Act (DRA) of 2005 as one of the reasons for the drop in utilization, the data do not support that conclusion, according to Levin.
"If the DRA was the cause of the drop in utilization, we would expect that the growth rate in private offices would be lower than it was in hospital outpatient facilities, and that's not the case," he said. "The DRA really didn't have a whole lot to do with this flattening."
By Erik L. Ridley
AuntMinnie.com staff writer
December 9, 2010
Related Reading
Senate reaches 1-year deal on SGR, December 8, 2010
Health Affairs articles explode self-referral myths, December 8, 2010
Nonradiologists power musculoskeletal ultrasound growth, December 2, 2010
GAO numbers overstate growth in medical imaging, May 4, 2010
Medicare cancer imaging grows at twice rate of overall expenses, April 27, 2010
Copyright © 2010 AuntMinnie.com

