The past few years have seen a burgeoning of interest in computer-aided-detection (CAD) schemes for virtual colonoscopy, and several studies demonstrating its successful use in the clinical setting. Various VC CAD schemes have detected anywhere from 70%-100% of clinically significant polyps, with 1-8 false positives per dataset.
Of course, colon CAD isn't nearly as far along as its mammography counterpart, which benefits from several FDA-approved CAD products and a rapidly growing installed base. But a robust VC CAD application would address many of the problems that have plagued mammography, including missed lesions due to operator fatigue and inexperience, time and cost constraints, and the need to read large numbers of datasets to serve a fast-growing screening population.
Researchers from the University of Chicago have been at the forefront of VC CAD research, having successfully deployed an automated shape-and-texture-based polyp detection scheme that uses a quadratic classifier to reduce the incidence of false positives. As an adjunct to the system, they also designed a colon segmentation technique that further reduces the number of false positives detected by CAD.
Now their project comes full circle with a system that detects not only polyps but also colorectal masses, based on wall-thickening analysis and so-called fuzzy merging. In a just-completed paper obtained by AuntMinnie.com, the University of Chicago group discusses the new system, which detected both detected colorectal masses and polyps with great accuracy.
"Colorectal masses are generally considered well visualized by a radiologist because of their size, continuation, and secondary findings," wrote study authors Janne Näppi, Ph.D., Hans Frimmel, Ph.D., Dr. Abraham Dachman, and Hiro Yoshida, Ph.D. "Thus, little effort has been made to develop CAD schemes for mass detection. Nevertheless, the detection of both polyps and masses by CAD in (VC) would provide a more comprehensive computer aid than the mere detection of polyps. In particular, the computer should not confuse masses with other lesions."
The goal was to develop a CAD scheme for the detection of both intraluminal and non-intraluminal masses, which are generally associated with mucosal wall thickening.
For this they needed two types of detection systems. The first method detects intraluminal masses by analyzing the so-called fuzzy memberships located between the initially detected suspicious polypoid regions. The second method searches for non-intraluminal masses in wall thickening.
A retrospective study of the CAD scheme was performed using 84 virtual colonoscopy datasets. The subjects underwent CT imaging from the rectum to the lung diaphragm following a standard colon-cleansing regimen on either a single-slice or multislice CT scanner (HiSpeed CT/i or LightSpeed QX/i, GE Medical Systems, Waukesha, WI). Images were acquired in both supine and prone positions with collimation of 1.25 to 5 mm, reconstruction intervals of 1 to 5 mm (91% between 1.5 and 2.5 mm), tube current of 50-160 mAs, and 120 kVp.
Conventional colonoscopy was also performed, resulting in the detection of 14 masses whose dimensions were measured both optically and from the corresponding CT data, then interpreted by the CAD scheme.
"The colonoscopic examination was incomplete in some of the mass cases, but no polyps nor additional masses could be found by an experienced radiologist in the CTC data in such cases," the authors wrote. "One of the masses, located in the rectum, was only partially visible in both supine in prone positions, because it was cut off by the CT reconstruction cylinder at the time the CT scan was performed."
In all there were 30 colonoscopy-confirmed polyps (5-25 mm) in 19 patients, four of which contained masses. Ten patients had masses only.
Fuzzy merging
The first of two methods for mass detection, fuzzy merging, combs the CT dataset for groups of polyp detections clustered in regions of interest, analyzing their attenuation values for features, such as separating boundaries, that would indicate a high probability of being separate lesions. The program also weights greater distances between such higher-attenuating regions as a factor that reduces their probability of being a single mass, unless the distance factor is outweighed by extremely high attenuation of the individual regions.
According to the authors, such regions cannot be grouped to another region when they have already been claimed for another cluster, which limits the CAD scheme's ability to detect long tumors as a single entity, though they are detected.
The process ends when there are no more mergeable mass candidates, at which point "the detections that are not labeled as mass candidates are considered polyp candidates...," the authors wrote.
 |
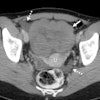
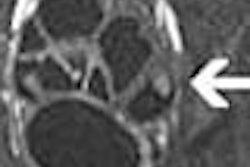
| Polypoid mass in the rectosigmoid colon (left, center), red region (right, center) indicates the mass region extracted by the CAD scheme for the detection of masses. Images courtesy of Dr. Hiro Yoshida. |
Intraluminal masses
The second of the two detection schemes relies on attenuation to identify the colon wall, then looks for colonic wall thickening in regions it deems suspicious if six criteria hold. These include higher attenuation indicating localized wall thickening, a solid tissue structure with limited attenuation differences, a clearly delineated wall region, an upper attenuation limit to ensure that osseous structures were not included, and minimum wall thickness. Finally, the algorithm imposes distance limitations to exclude the presence of organs adhering to the colonic wall.
The suspected thickened regions are then checked for symmetry, and to ensure that there was thickening on both sides of the wall. Gradient vectors are examined to eliminate false positives due to retained fluid. The suspected masses are then extracted by means of a level-set method that determines the complete region of a mass candidate.
Performance of the intraluminal mass detection method was evaluated with a by-mass analysis and leave-one-out (round-robin) method, the authors wrote.
 |
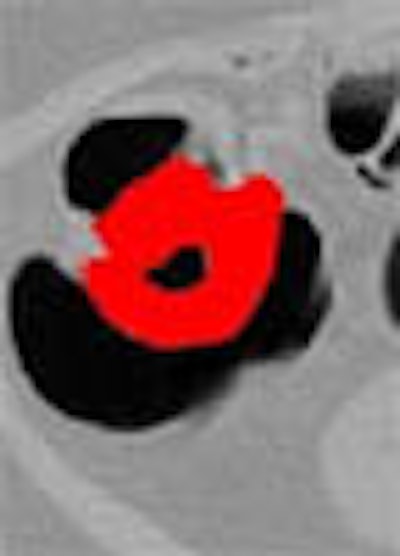
| Large circumferential mass in the cecum (far left). Red area (right image) indicates the mass region extracted by the CAD scheme for the detection of masses. Images courtesy of Dr. Hiro Yoshida. |
According to the results, "all masses but one that was partially cut off from the CTC dataset were detected at a 93% sensitivity, with an average false-positive rate of 0.21 (false positives) per patient," the authors wrote. Eleven of the masses were detected by fuzzy merging, and three were detected by the wall-thickening analysis, including both of the intraluminal masses. There was no polyp missed as a result of the mass-detection scheme when a polyp-detection scheme was also used.
"The results indicate that the scheme is potentially useful in providing a high-performance CAD scheme for the detection of colorectal neoplasms in (virtual colonoscopy)," they wrote.
By Eric BarnesAuntMinnie.com staff writer
October 10, 2003
Related Reading
Colon CAD finds complementary role with radiologists, April 23, 2003
Knowledge-guided segmentation improves polyp detection, October 18, 2002
Virtual colonoscopy: 2-D vs. 3-D primary read, June 3, 2002
Prepless virtual colonoscopy shows early promise, June 3, 2002
New CAD technique improves CT colonography, December 21, 2001
Copyright © 2003 AuntMinnie.com


