A new investigational computer-aided detection (CAD) application significantly improves the accuracy of virtual colonoscopy interpretation, both as standalone software without a radiologist and in a real-world, multireader environment.
According to two new studies, the CAD scheme for virtual colonoscopy (also known as CT colonography or CTC) is not only sensitive for detecting colorectal polyps of all sizes and morphologies, it also improves readers' detection sensitivity by at least 5%.
At the 2009 International Symposium on Virtual Colonoscopy in Reston, VA, Dr. Abraham Dachman, professor of radiology and director of CT at the University of Chicago, presented results for the investigational software package working on its own (VeraLook 1.0, iCAD, Nashua, NH). Dachman followed up at the 2009 RSNA meeting in Chicago with a second study demonstrating the software's impact on 19 experienced readers of virtual colonoscopy data.
The studies relied on publicly available CTC data from the Naval Medical Center in San Diego and the Walter Reed Army Medical Center in Washington, DC.
CAD alone
The standalone CAD study examined the system's performance without a radiologist to review the results, an important test of the software's ability to detect polyps and reject false-positive findings.
Dachman, along with colleagues including Nancy Obuchowski, Ph.D., Dr. Jeffrey Hoffmeister, and Dr. Thomas Winter, assessed the software's sensitivity for polyps stratified by size, histopathology, and morphology. A secondary aim of the study was to look at the algorithm's true-positive rate by histology and location.
"I don't think there's any data in the literature on any CAD product that's gone to that level of detail -- at least, I couldn't find any," Dachman said in his presentation.
Virtual colonoscopy datasets were culled from 342 asymptomatic screening patients (average age, 67 years). All of the individuals had optical colonoscopy in addition to prone and supine screening VC with a saline and cathartic prep, oral contrast for stool tagging, and insufflation with room air. Images were acquired on a 64-detector-row CT scanner and interpreted on a review workstation (V3D-Colon, Viatronix, Stony Brook, NY).
In the patient population, 184 patients had polyps 6 mm or larger, with polyps confirmed by at least two of three highly experienced radiologists who participated in a "truth panel" to evaluate polyps that were not removed at colonoscopy. In the remaining 171 individuals screened, no polyps 5 mm or larger were seen by any modality.
The truth panel included:
- Independent review by two highly experienced readers; a third reader arbitrated, if needed, for all collected cases
- Finalized classification of cases as positive, negative, or excluded
- Establishment of polyp localization, morphology (sessile, pedunculated, or flat), and size (largest linear dimension)
- Unblinded access to available clinical information
CAD's per-patient sensitivity was 91.8% for polyps 6 mm or larger, 92% for all polyps, and 90% for 6- to 9-mm polyps, Dachman said.
"There was a trend toward improvement in patients with larger polyps, but the difference was not statistically significant," Dachman said. "That's interesting because it means the CAD does really well on small polyps, too," he said.
Per-polyp sensitivity was high:
- 93.2% for adenomas 10 mm and larger
- 86% for all polyps
- 85.5% for 6- to 9-mm polyps
- 88% for polyps 10 mm and larger
In per-polyp calculations like per-patient analyses, "polyp size was not a significant predictor of sensitivity," Dachman said. Also important, CAD sensitivity was not significantly different between adenomatous and nonadenomatous polyps, a favorable CAD system result "because you can't tell if it's an adenoma or not until you biopsy, so it's important to researchers," Dachman said.
By morphology, overall sensitivity was 90% for sessile polyps and 64% for lesions defined as flat per C-RADS criteria. CAD generated an average 4.59 false positives per view (prone and supine).
"High sensitivity was maintained for small and large polyps, both adenomas and nonadenomas," Dachman said. "CAD ... performed at a high level of standalone sensitivity and specificity when tested in a uniquely diverse cohort."
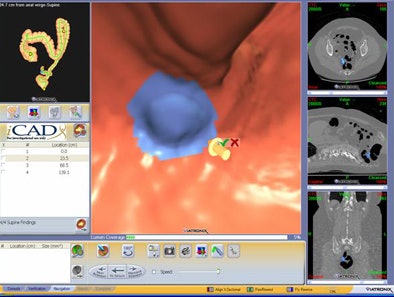 |
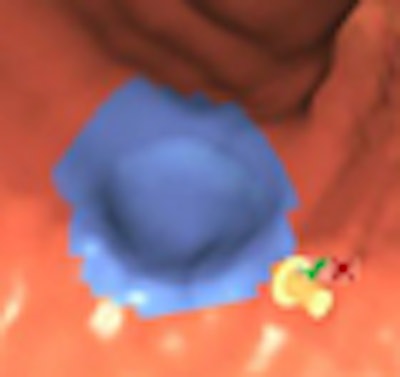
| Graphic user interface from CAD (VeraLook 1.0) shows true-positive CAD detection of polyp located on a haustral fold, in addition to corresponding 3D and 2D views. Image courtesy of Dr. Abraham Dachman. |
CAD also helps readers
While standalone sensitivity studies are useful for assessing and comparing the detection abilities of software products, what's more important is the effect of CAD on readers -- whether it improves their ability to detect clinically significant lesions in a time-efficient manner.
For this evaluation, reader studies are essential, though very few have been performed, Dachman said. Those that exist have small patient cohorts or small numbers of readers.
Each CAD application has a unique algorithm for polyp candidate feature analysis and classifiers for false-positive reduction, he said. The results of one system cannot be extrapolated to another. Each algorithm also performs differently, with different polyp detection rates, false-positive rates, and methods of displaying CAD output, Dachman said in his RSNA presentation.
To evaluate how CAD affects CTC exam interpretation, Dachman and colleagues randomly selected 100 CTC studies from publicly available data, such as the first study acquired at the Naval Medical Center and Walter Reed Army Medical Center. All CTC studies were acquired with four-detector-row or higher CT scanners using clinically acceptable CTC scan parameters, slice thickness ≤ 3 mm, prone and supine views, and diagnostic-quality scans.
Once again, the results were reviewed with iCAD VeraLook 1.0 software running on a Viatronix V3D-Colon review workstation.
Of the 100 patients evaluated, 52 were positive and 48 were negative for polyps 5 mm and larger. Screening CTC was indicated for all patients who had no history of rectal bleeding, polyps, inflammatory bowel disease, prior colon surgery, or family or personal history of colorectal carcinoma.
As in the standalone study, a saline prep was combined with an oral contrast for tagging.
The data were examined by 19 board-certified radiologists selected from both academic and community environments. The readers averaged five years of experience each and an average reading of 92 CTC cases per year. All readers were trained on the software, confidence scale, and study methods.
Each reader performed 200 readings -- reading each dataset twice, once with CAD and once without CAD. Assisted and unassisted reads of the same case were separated by 27 to 58 days, and no case was viewed twice in the same session.
No time limits were imposed, but readers were blinded to the case type and number of positive and negative cases. The readers used the interpretation method they were most comfortable with in clinical practice, either primary 2D or primary 3D, Dachman said. The truth panel, in case of disagreement, was the same as for the standalone study.
The investigators recorded a C-RADS score for case start and end times.
According to the results, the average segment-level receiver operator characteristics (ROC) area was statistically significantly greater for assisted reads than unassisted reads (p = 0.015, 95% confidence interval [CI]: 0.004 to 0.039).
The researchers did not provide actual sensitivity figures, citing the upcoming publication of the paper. But they did note that CAD improved sensitivity by at least 5% according to several different measures:
- By segment (5.2%)
- By patient (5.5%)
- By polyp (5.5%)
CAD also improved sensitivity for several subcategories of polyps, including large (> 10 mm) and small (6-9 mm) polyps. CAD improved detection sensitivity of adenomatous polyps by 8.3% compared to results without CAD.
In fact, the improvement in sensitivity for the average reader was statistically significant for all analyses and all categories considered, Dachman said, though the number of false-positive findings increased when readers used CAD.
The average number of false-positive findings per patient was 0.083 without CAD and 0.118 with CAD (95% CI: -0.014 to 0.090). Reading time increased by an average of 4.5 minutes with the use of CAD.
Average reader specificity dropped slightly with the use of CAD:
- Per-segment specificity decreased from 98.4% without CAD to 97.5% with CAD (p = 0.001, 95% CI for reduction: 0.4% to 1.4%)
- Per-patient specificity decreased from 92.9% without CAD to 90.4% with CAD (p = 0.005, 95% CI for reduction: -0.02% to 5.1%)
CAD improved reader sensitivity by segment, by patient, and by polyp for small polyps and adenomas, with the greatest sensitivity gain found in 6- to 9-mm adenomas, Dachman said.
In all, 10 of 19 readers showed detection sensitivity increases of more than five percentage points. Sensitivity for cases with at least one large polyp 10 mm or larger was also higher with CAD than without (77.7% versus 74.3%, p = 0.047), the authors wrote in an abstract.
By Eric Barnes
AuntMinnie.com staff writer
February 15, 2010
Related Reading
New VC CAD algorithm reveals submucosal colon cancers, February 4, 2010
VC screening effective in Medicare-age screening cohort, January 27, 2010
Lesion size and morphology at VC good predictors of histology, December 22, 2009
VC CAD nabs undetected polyps in jumbo screening study, October 29, 2009
Readers undaunted by VC CAD false positives, June 12, 2009
Copyright © 2010 AuntMinnie.com


