
Using machine-learning algorithms and functional MRI (fMRI) scans, researchers can identify suicidal individuals by analyzing the alterations in how their brains represent certain concepts, such as death, cruelty, and trouble, according to a study published October 30 in Nature Human Behaviour.
The researchers from Carnegie Mellon University and the University of Pittsburgh presented a list of 10 death-related words, 10 words related to positive concepts (e.g., carefree), and 10 words related to negative ideas (e.g., trouble) to two groups of 17 people with known suicidal tendencies and 17 neurotypical individuals.
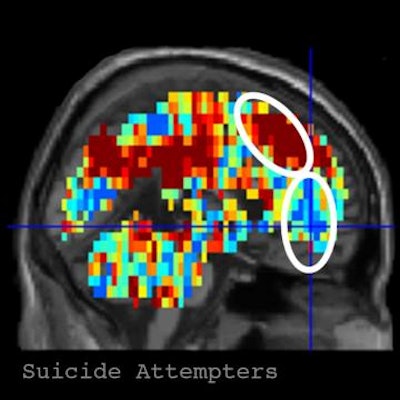
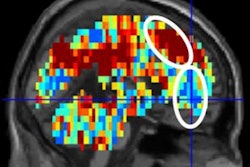
 At left is the brain activation pattern for "death" in participants who had made a suicide attempt. The image at right depicts the activation pattern for "death" in control participants. Image courtesy of Carnegie Mellon University.
They applied the machine-learning algorithm to six word-concepts that best discriminated between the two groups as the participants thought about each word while in the scanner. These were death, cruelty, trouble, carefree, good, and praise. Based on the areas of the brain that lit up on the fMRI scans, the program was able to identify with 91% accuracy whether a participant was from the control or suicidal group.
Focusing on the suicidal ideators, the researchers used a similar approach to see if the algorithm could identify participants who had made a previous suicide attempt from those who only thought about it. The program was able to distinguish the nine people who had attempted to take their lives with 94% accuracy.
More studies are needed; a larger sample size will determine the algorithms generality and its ability to predict future suicidal behavior, the researchers noted.

![Overview of the study design. (A) The fully automated deep learning framework was developed to estimate body composition (BC) (defined as subcutaneous adipose tissue [SAT] in liters; visceral adipose tissue [VAT] in liters; skeletal muscle [SM] in liters; SM fat fraction [SMFF] as a percentage; and intramuscular adipose tissue [IMAT] in deciliters) from MRI. The fully automated framework comprised one model (model 1) to quantify different BC measures (SAT, VAT, SM, SMFF, and IMAT) as three-dimensional (3D) measures from whole-body MRI scans. The second model (model 2) was trained to identify standardized anatomic landmarks along the craniocaudal body axis (z coordinate field), which allowed for subdividing the whole-body measures into different subregions typically examined on clinical routine MRI scans (chest, abdomen, and pelvis). (B) BC was quantified from whole-body MRI in over 66,000 individuals from two large population-based cohort studies, the UK Biobank (UKB) (36,317 individuals) and the German National Cohort (NAKO) (30,291 individuals). Bar graphs show age distribution by sex and cohort. BMI = body mass index. (C) After the performance assessment of the fully automated framework, the change in BC measures, distributions, and profiles across age decades were investigated. Age-, sex-, and height-adjusted body composition reference curves were calculated and made publicly available in a web-based z-score calculator (https://circ-ml.github.io).](https://img.auntminnie.com/mindful/smg/workspaces/default/uploads/2026/05/body-comp.XgAjTfPj1W.jpg?auto=format%2Ccompress&fit=crop&h=100&q=70&w=100)


![Overview of the study design. (A) The fully automated deep learning framework was developed to estimate body composition (BC) (defined as subcutaneous adipose tissue [SAT] in liters; visceral adipose tissue [VAT] in liters; skeletal muscle [SM] in liters; SM fat fraction [SMFF] as a percentage; and intramuscular adipose tissue [IMAT] in deciliters) from MRI. The fully automated framework comprised one model (model 1) to quantify different BC measures (SAT, VAT, SM, SMFF, and IMAT) as three-dimensional (3D) measures from whole-body MRI scans. The second model (model 2) was trained to identify standardized anatomic landmarks along the craniocaudal body axis (z coordinate field), which allowed for subdividing the whole-body measures into different subregions typically examined on clinical routine MRI scans (chest, abdomen, and pelvis). (B) BC was quantified from whole-body MRI in over 66,000 individuals from two large population-based cohort studies, the UK Biobank (UKB) (36,317 individuals) and the German National Cohort (NAKO) (30,291 individuals). Bar graphs show age distribution by sex and cohort. BMI = body mass index. (C) After the performance assessment of the fully automated framework, the change in BC measures, distributions, and profiles across age decades were investigated. Age-, sex-, and height-adjusted body composition reference curves were calculated and made publicly available in a web-based z-score calculator (https://circ-ml.github.io).](https://img.auntminnie.com/mindful/smg/workspaces/default/uploads/2026/05/body-comp.XgAjTfPj1W.jpg?auto=format%2Ccompress&dpr=2&fit=crop&h=167&q=70&w=250)


