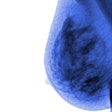
The variation of tissue density in a woman's breast is at least as strong an indicator of cancer risk as the actual density itself, according to a new study published online July 3 in the Journal of the National Cancer Institute.
A woman's mammographic breast density -- i.e., her proportion of fibroglandular tissue -- is an established risk factor for breast cancer, according to lead author John Heine, PhD, of the Mayo Clinic in Rochester, MN, and colleagues. But breast density isn't fully used in the clinical setting, partly because standardizing density measures remains a challenge.
"The successful incorporation of mammographic density into the clinical setting relies on an algorithm to accurately and reliably quantify density independent of a reader and in a manner that does not disrupt clinic flow or patient management," Heine and colleagues wrote. "The ideal density measure would apply across mammography screening centers and imaging platforms, preferably in an automated and standardized manner" (JNCI, July 3, 2012).
Heine's group developed an automated method to estimate mammographic density using full-field digital mammography. The method assesses the variation of the grayscale values underlying the image in a calibrated mammogram; the variation measure is the standard deviation of the calibrated pixel values, the team wrote.
"[Our study goals] were to examine associations between the variation measure and the risk of breast cancer in three independent epidemiological studies and to compare the magnitude of associations with breast cancer for the variation measure and the well-established percent density measure," according to the authors.
The study collected data from a case-cohort study and two case-control studies, which included a total of 1,391 women with breast cancer (case subjects) and 3,649 women without breast cancer (control subjects). The researchers estimated the women's percent density from digitized mammograms and estimated variation in density using the automated algorithm.
The algorithm works in three steps:
- The breast area on the craniocaudal mammogram view is automatically segmented from the background to remove image artifacts and detect the breast area.
- Unwanted spatial variation is reduced by eliminating the portion of the projected breast area corresponding to large variations in compressed breast thickness during imaging and retaining that which is approximately of uniform thickness.
- The variation measure is calculated as the standard deviation of the pixel values within the eroded breast region for each study image.
"Basically, the first two steps cut the actual breast from the mammogram and then attempt to find an area that corresponds to where the compressed breast is of uniform -- or approximately the same -- thickness," contributing author Celine Vachon, PhD, told AuntMinnie.com. "Then, the variation of this compressed region is calculated."
The group found that the associations between the variation measure and the risk of breast cancer were similar to those between percent density and breast cancer; like the percent density measure, which associates higher density with increased cancer risk, women with higher variation measures were also at higher risk, Vachon said.
"In all three studies, the variation measure corresponded to cancer risk as well as the percent [density] measure did," she said.
The fact that the variation measure can be automated is key, Vachon noted.
"There's a lot of focus on breast tissue density now, especially with the density notification legislation that's been adopted in various states," she said. "But we don't know if BI-RADS or percent density are comparable measures across populations; a woman's estimated density may not be the same in Connecticut as compared to California. The key to this [variation] measure is that it's automated and could produce the same results."


