A face-off between two lung nodule computer-aided detection (CAD) systems found a big difference in sensitivity for detecting solid pulmonary nodules, but it also revealed the good news that nodule detection was unaffected by low-dose scanning. The number of false positives also differed significantly between the two systems, researchers from Germany reported.
The study, by Dr. Valentina Romano and colleagues from Charité Medical University in Berlin, compared the results of two lung CAD systems: a precommercial software application (CAD-1) from Philips Healthcare of Andover, MA, and LungCare CAD (CAD-2), a commercially available application from Siemens Healthcare of Erlangen, Germany.
"The purpose of our study was to evaluate the impact of dose reduction on performance of computer-aided lung nodule detection systems," Romano said at the 2009 European Congress of Radiology (ECR).
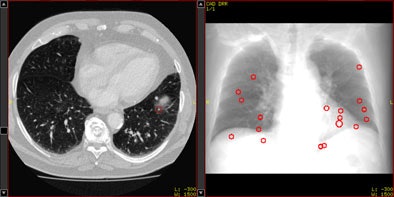 |
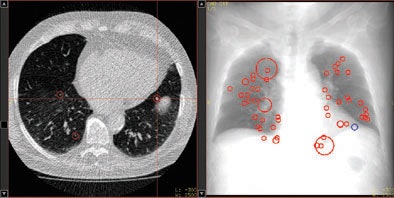
| Above, axial CT image in standard-dose CT (SD-CT) showing a nodule in juxtadiaphragmatic location missed by CAD-1. Above right, CAD markers resulting from the analysis of the SD-CT data presented in a coronal view. Below, CAD analysis of the ultralow-dose CT (ULD-CT) data resulted in automated detection of the corresponding nodule in the left lower lobe. On the right, CAD markers resulting from the analysis of the ULD-CT data. All images courtesy of Dr. Valentina Romano. |
 |
The group compared the results of CAD analysis by assessing detection sensitivity and false-positive detections with ultralow-dose CT (ULD-CT) and standard-dose CT (SD-CT) protocols. Data were collected on 26 patients with known lung cancers.
"The patients were all referred to our institution because of staging or restaging in the case of extrathoracic malignancy or primary lung cancer, or in case of suspected nodules after a chest x-ray," she said.
CT images were consecutively acquired at 5 mAs (ULD-CT) and 75 mAs (SD-CT) with 120 kV tube voltage and 1-mm slice thickness. Images were examined using a soft-tissue kernel as recommended by the manufacturers.
"Ground truth was established by consensus of three experienced radiologists; there were 253 ... nodules ranging from 2 to 41 mm, and each dataset had between one and 28 nodules," Romano said.
The sensitivity results for both systems did not decline significantly for standard-dose protocols versus low-dose settings: for SD-CT and ULD-CT, respectively, the sensitivity for detecting nodules 4 mm and larger was 72% and 73% for the CAD-1 application and 62% and 56% for CAD-2.
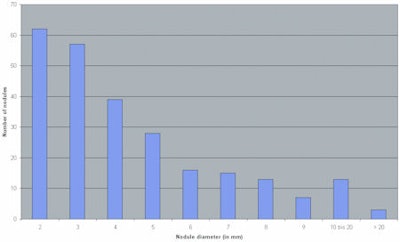 |
| Bar graph illustrates the distribution of 253 nodules 2 mm in diameter or larger, according to diameter range. Y-axis = number of nodules; x-axis = nodule diameter (in mm), increasing left to right from 2 to > 20. |
"Indeed, we found a statistically significant difference in the detection rate of CAD system 1 versus CAD system 2 -- with system 1 being slightly better," Romano said. However, although CAD-1 had higher detection sensitivity, it also produced more false-positive detections than CAD-2.
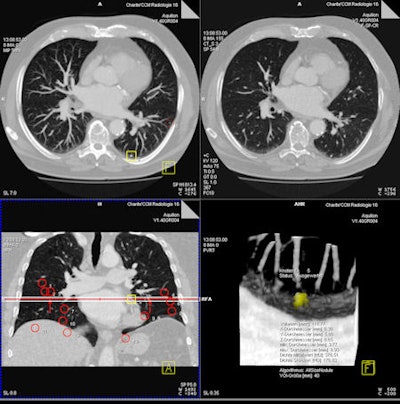 |
| Representative images of CT data analysis with CAD-2. The successful detection is presented in an axial maximum intensity projection (MIP) (upper left), in a thin-slice axial reconstruction (upper right), and as CAD marker in a coronal MIP (lower left), as well as in a volume-rendered view (lower right). |
Median false-positive rates per patient were five for CAD-1 versus six for CAD-2 with SD-CT. For ULD-CT, rates were eight for CAD-1 and three for CAD-2.
After separate statistical analysis of nodules with diameters of 5 mm and larger, detection rates increased to 83% for CAD-1 and 61% for CAD-2 at SD-CT and to 89% for CAD-1 and 67% for CAD-2 at ULD-CT. Overall, for both CAD systems, there were no significant differences between the detection rates for standard-dose and ultralow-dose datasets (p > 0.05).
Still, the number of false positives was highly variable by case, CAD system, and the use of standard or low-dose CT protocols.
"In case 21, CAD-1 found more than 25 false-positive nodules in a standard-dose CT scan," Romano said. "If we look at the ultra-low-dose results for CAD-2 [in the same case], there were absolutely no false-positive findings. In another example, there were more than 35 false-positive findings in CAD-1 in the ultra-low-dose dataset and only five false positives using standard dose for both CAD systems."
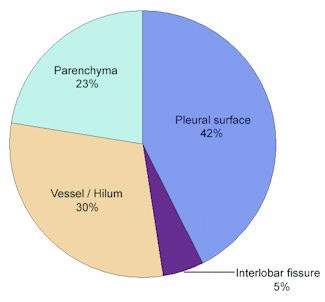
Differences between the systems could also be seen in the distribution of detected nodules, she said. "CAD-1 seemed to have more difficulties finding nodules close to the vessels, with 56% of the nodules missed," she said. CAD-2 had more difficulty finding nodules close to the pleural surface, with 42% missed nodules.
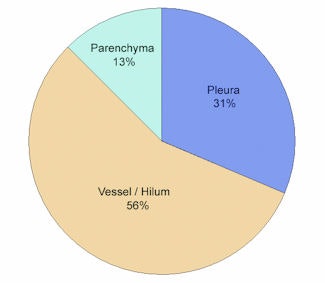 |
| Above, graph shows the distribution of nodules (5 mm and larger) missed by CAD-1 with respect to location (in percentages). Below, graph shows the distribution of nodules (5 mm and larger) missed by CAD-2 with respect to location (in percentages). |
 |
However, both CAD systems at both dose levels missed nodules at all size ranges. Most nodules were parenchymal, 24% had pleural contact, and 14% were interlobular, close to the hilum and to the larger vessels, Romano said.
 |
| TP = true positive; FP = false positive. Detection rate/false positives for CAD-1, CAD-2 at both dose levels. Detection rate CAD-1 versus CAD-2: p = 0.023. Detection rate SD-CT versus ULD-CT (both for CAD-1 and CAD-2): p > 0.05. |
 |
| Detection rate for pulmonary nodules > 4 mm (n = 95). |
Dose reduction of the underlying CT scan and consecutive increased image noise did not significantly influence nodule detection performance of the tested CAD systems, Romano said.
By Eric Barnes
AuntMinnie.com staff writer
May 11, 2009
Related Reading
Computer-aided system increases detection of early-stage lung cancer, May 4, 2009
CAD may improve novice performance in pulmonary CTA, March 26, 2009
Criteria determine CAD mark sensitivity, March 20, 2008
CAD provides mixed benefits for DR lung exams, March 8, 2008
DR image processing produces mixed CAD results, February 12, 2008
Copyright © 2009 AuntMinnie.com


