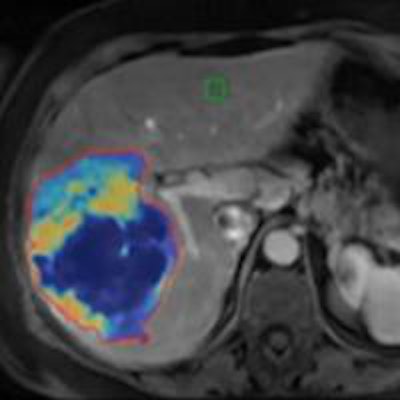
Researchers from Johns Hopkins Hospital have developed 3D quantification software that can accurately quantify the extent of liver tumor necrosis from MRI after initial chemoembolization. It can also predict patient survival by identifying responders and nonresponders to treatment.
In presentations at the recent Society of Interventional Radiology (SIR) annual meeting, the Johns Hopkins team shared results showing radiologic-pathologic correlation of the 3D quantification software, as well as its capabilities in predicting treatment response and survival in patients with colorectal metastases to the liver and uveal melanoma metastatic to the liver.
"Our system is workflow-efficient, pathologically accurate, very reproducible, and fully validated in primary and secondary liver cancers," Dr. Julius Chapiro told AuntMinnie.com.
Liver cancer on the rise
Liver cancer is the second most common cause of cancer-related death in the world, and it's on the rise, particularly in Europe and the U.S. Because liver cancer has almost no early symptoms and most patients get diagnosed at late stages when surgery isn't an option, more than 50% of all liver cancer patients undergo image-guided therapies performed by interventional radiologists, Chapiro said.
Assessing treatment success/response remains a key issue, however. Decisions about whether to retreat patients after initial therapy are mostly based on MRI, and several imaging biomarkers have been developed to monitor tumor response. Existing markers such as one-dimensional Response Evaluation Criteria in Solid Tumors (RECIST) and modified RECIST (mRECIST), as well as 2D European Association for the Study of the Liver (EASL) measurements, are usually handled manually by a radiologist using simple ruler-like instruments on MR images, according to Chapiro.
"So far, all those manual one- and two-dimensional measurements have proven ineffective and suffer from lack of reproducibility," he said. "They also show very limited correlation with real tumor pathology as seen on explants after liver surgery/transplantation."
Many had hoped that segmentation-based 3D techniques would alleviate those issues, but the methods haven't been clinically practicable, he said.
"No radiologist would spend three hours per patient to manually segment the tumors," Chapiro said. "This is where we started thinking of workflow-efficient solutions. It was a strategic decision made by our team to tackle this problem and to provide and validate a tool, which would finally be able to make a difference -- both technically as well as practically."
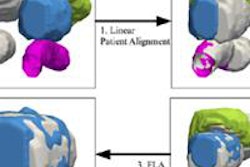
The Johns Hopkins team developed software that makes use of contrast-enhanced MR images and comprises four elements:
- Semiautomated tumor segmentation on the arterial-phase scan
- Image registration between native and contrast-enhanced images
- Image subtraction: In this phase, the native image is subtracted from the contrast-enhanced image to remove background and false-positive MR signal, so that only tumor enhancement within viable tumor remains
- Quantification of the enhancing tumor volume in cubic centimeters
"Using this system, we can now measure on every single MRI how much enhancing/viable tissue is left," Chapiro said. "This really simple mechanism of MR signal quantification is so simple that we have now expanded this algorithm onto diffusion-based imaging, T2 sequences, and virtually any other MR sequence. Furthermore, we can measure the signal on contrast-enhanced CT as well as intraprocedural [conebeam CT] and compare all three modalities. This is truly unique."
Chapiro and Dr. Jean-Francois Geschwind, from the hospital's department of interventional radiology, as well as MingDe Lin, PhD, of Philips Healthcare, served as key researchers on the project.
Semiautomated method
The Johns Hopkins technique is semiautomated, which offers several benefits to radiologists over fully automated approaches, Chapiro said. It's fast, producing tumor segmentation within five to 10 seconds.
Also, "the radiologist doesn't have to feel like he's working with a black box that spits out a result with no chance to influence the algorithm," he said. "With our system, the reader can improve the software-based result by manually correcting, for example, tumor edges. This is really a small revolution in our world of tumor analysis, and it will help the users to finally gain trust and confidence in a software-based system."
In addition, the system has been shown -- with radiological-pathological correlation -- to accurately predict the extent of tumor necrosis on imaging. The Johns Hopkins team presented the findings in a paper at the SIR meeting.
Their study included 17 patients who had received transarterial chemoembolization (TACE). For this group, the software's quantification of necrosis in the percentage of tumor volume based on European Association for the Study of the Liver (qEASL) and quantitative apparent diffusion coefficient (qADC) criteria correlated strongly with pathology results (r2 = 0.9657 and r2 = 0.9662, respectively). The methods also outperformed visual analysis by two board-certified radiologists, who had correlation with pathology results of r2 = 0.8751 and r2 = 0.8926, respectively. The two radiologists had an interreader correlation of r2 = 0.8321.
The qEASL and qADC methods showed high overall accuracy for predicting pathological necrosis after TACE and also showed strong intermethod agreement (r2 = 0.9585). Both 3D quantitative techniques demonstrated advantages over subjective measurements, according to the researchers.
"We are the first to deliver proof for the superiority of 3D quantitative, semiautomated image assessment techniques over manual measurement in patients with liver cancer after local therapies," Chapiro said.
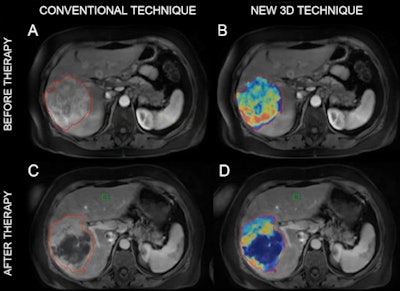 MR images of a patient with primary liver cancer. Images A and B show the patient before being treated with chemoembolization. The new 3D technique helped quantify the volume and distribution of viable tumor tissue (shown in red and yellow). Images C and D are MR scans acquired after the treatment. The 3D method helped the radiologists quantify the vast central destruction of the tumor after treatment. Dead tumor is shown in blue. Image courtesy of Dr. Julius Chapiro.
Colorectal metastases
The team also presented a study that evaluated quantitative 3D volumetric assessment of tumor response after intra-arterial therapy for colorectal metastases to the liver.
Colorectal cancer is the third most commonly diagnosed cancer, and 70% metastasize to the liver. Chemoresistance and disease progression within the liver is the most common cause of death in these patients, according to the researchers.
A 29-patient study found that traditional one-dimensional and 2D markers such as EASL and mRECIST showed no ability to stratify patients as responders or nonresponders after initial treatment. However, qEASL did (p = 0.031) and was the only imaging marker that predicted patient survival.
In a third study presented at SIR 2014, the Johns Hopkins team found that volumetric tumor enhancement (as calculated via qEASL by the software) on contrast-enhanced and diffusion-weighted MRI could be used as surrogate biomarker for survival in patients with uveal melanoma metastatic to the liver after the first TACE procedure.
"We have now demonstrated that using this system for tumor response assessment provides a better prediction of prognosis in primary and metastatic liver cancer as compared to all 1D and 2D techniques," Chapiro said.
Intraprocedural imaging
Another benefit of the software is that it can be applied to CT and conebeam CT imaging. In fact, the researchers recently published a paper in Academic Radiology to this effect (March 2014, Vol. 21:3, pp. 393-399).
"This is really important because intraprocedural imaging is gaining weight in the overall management of patients," Chapiro said.
Johns Hopkins has licensed the system to Philips, and the Johns Hopkins team is working with the company to make it available in all Philips workstations worldwide for everyday use.
"This should happen sometime in the near future," he said.
In addition, the group is expanding the use of the tool toward other therapies (such as systemic chemotherapies and stereotactic radiation), as well as other regions of the body (such as for tumors of the brain and uterus).
"Ultimately, we want this system to be used as an everyday tool for diagnostic and follow-up purposes on all cross-sectional modalities," Chapiro said.


