
MRI scans in combination with a computer algorithm helped researchers predict which infants with older autistic siblings would exhibit autistic characteristics themselves by age 2, according to a study published online February 15 in Nature.
The group accurately identified 80% of the babies who would develop signs of autism by age 2. The findings show how early brain development biomarkers could be useful in identifying babies who are at the greatest risk for autism before behavioral symptoms begin to surface, said senior author Dr. Joseph Piven from the University of North Carolina at Chapel Hill in a statement.
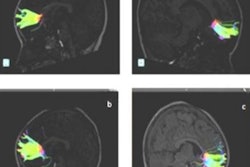
The study involved researchers from across the U.S. and Canada and included hundreds of children from both countries. MRI scans were performed on infants at 6, 12, and 24 months of age.
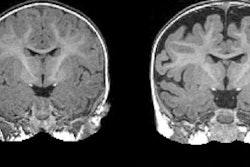
MRI revealed a hyperexpansion of the brain's surface area from 6 to 12 months in babies who developed autism, compared with babies who did not show evidence of the condition at 24 months of age. The increased growth rate of surface area during the infant's first year was associated with an increased growth rate of overall brain volume in the second year. That brain "overgrowth" was tied to the emergence of autistic social deficits in the second year.
With their data on brain volume, surface area, and cortical thickness at 6 and 12 months of age, as measured by MRI, the researchers then used a computer program to generate a way to classify babies most likely to meet criteria for autism at 24 months. The computer algorithm was tested on a different group of study subjects.
Piven and colleagues found that brain differences at 6 and 12 months of age in infants with older siblings with autism correctly predicted eight (80%) out of 10 infants who would later meet criteria for autism at 24 months, compared with infants with older autistic siblings who did not meet criteria for autism at 24 months.
"This means we potentially can identify infants who will later develop autism, before the symptoms of autism begin to consolidate into a diagnosis," Piven said.
On a more macro scale, the findings could lead to the discovery of biomarkers for autism, which could allow treatment to begin before substantial brain changes occur and symptoms develop, he added.
![Overview of the study design. (A) The fully automated deep learning framework was developed to estimate body composition (BC) (defined as subcutaneous adipose tissue [SAT] in liters; visceral adipose tissue [VAT] in liters; skeletal muscle [SM] in liters; SM fat fraction [SMFF] as a percentage; and intramuscular adipose tissue [IMAT] in deciliters) from MRI. The fully automated framework comprised one model (model 1) to quantify different BC measures (SAT, VAT, SM, SMFF, and IMAT) as three-dimensional (3D) measures from whole-body MRI scans. The second model (model 2) was trained to identify standardized anatomic landmarks along the craniocaudal body axis (z coordinate field), which allowed for subdividing the whole-body measures into different subregions typically examined on clinical routine MRI scans (chest, abdomen, and pelvis). (B) BC was quantified from whole-body MRI in over 66,000 individuals from two large population-based cohort studies, the UK Biobank (UKB) (36,317 individuals) and the German National Cohort (NAKO) (30,291 individuals). Bar graphs show age distribution by sex and cohort. BMI = body mass index. (C) After the performance assessment of the fully automated framework, the change in BC measures, distributions, and profiles across age decades were investigated. Age-, sex-, and height-adjusted body composition reference curves were calculated and made publicly available in a web-based z-score calculator (https://circ-ml.github.io).](https://img.auntminnie.com/mindful/smg/workspaces/default/uploads/2026/05/body-comp.XgAjTfPj1W.jpg?auto=format%2Ccompress&fit=crop&h=100&q=70&w=100)


![Overview of the study design. (A) The fully automated deep learning framework was developed to estimate body composition (BC) (defined as subcutaneous adipose tissue [SAT] in liters; visceral adipose tissue [VAT] in liters; skeletal muscle [SM] in liters; SM fat fraction [SMFF] as a percentage; and intramuscular adipose tissue [IMAT] in deciliters) from MRI. The fully automated framework comprised one model (model 1) to quantify different BC measures (SAT, VAT, SM, SMFF, and IMAT) as three-dimensional (3D) measures from whole-body MRI scans. The second model (model 2) was trained to identify standardized anatomic landmarks along the craniocaudal body axis (z coordinate field), which allowed for subdividing the whole-body measures into different subregions typically examined on clinical routine MRI scans (chest, abdomen, and pelvis). (B) BC was quantified from whole-body MRI in over 66,000 individuals from two large population-based cohort studies, the UK Biobank (UKB) (36,317 individuals) and the German National Cohort (NAKO) (30,291 individuals). Bar graphs show age distribution by sex and cohort. BMI = body mass index. (C) After the performance assessment of the fully automated framework, the change in BC measures, distributions, and profiles across age decades were investigated. Age-, sex-, and height-adjusted body composition reference curves were calculated and made publicly available in a web-based z-score calculator (https://circ-ml.github.io).](https://img.auntminnie.com/mindful/smg/workspaces/default/uploads/2026/05/body-comp.XgAjTfPj1W.jpg?auto=format%2Ccompress&dpr=2&fit=crop&h=167&q=70&w=250)


