
MRI and MR spectroscopy of cerebral blood flow in people with autism spectrum disorder are offering new insights into how the brain appears to compensate for the disruption of communication between cells. Study results were published online recently in Biological Psychiatry.
Researchers at Children's Hospital Los Angeles (CHLA) observed that increased brain activity correlated with a greater degree of autism severity. The finding contradicts conventional wisdom that autism spectrum disorder causes a deficiency in white-matter integrity through decreased blood flow.
"This is a multimodal imaging dataset. Each modality gives us a different window into the brain," said study co-author Dr. Bradley Peterson, director of CHLA's Institute for the Developing Mind, in a statement from the hospital. "We are able to look through both windows at once to tell us much more about what's going on in the brains of these individuals."
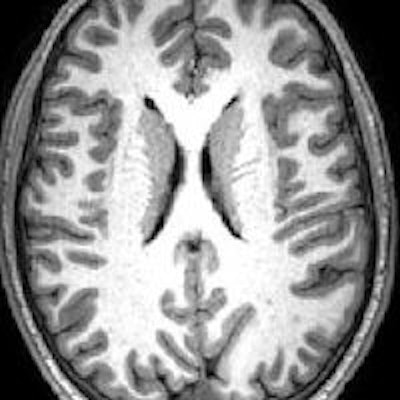
 MR image shows gray matter wrapping around the folds of the brain like a thin sheet. White matter, composing a large part of the image, connects brain cells and allows them to communicate. Image courtesy of CHLA.
The prevalence of autism spectrum disorder has nearly tripled over the past 15 years, with one in 59 children diagnosed with the condition. Given that rise, there is a concerted effort among researchers to better understand its causes.
In this study, the researchers' primary objective was to assess resting cerebral blood flow (rCBF) in 44 high-functioning children and adults with autism spectrum disorder. They compared the results with those of 66 normal control subjects. The groups were matched for age, gender, and IQ (Biol Psychiatry, December 20, 2018).
The subjects underwent MRI scans that included arterial spin labeling (ASL) to measure blood flow through the vessels of the brain. They also underwent MR spectroscopy to measure the level of N-acetylaspartate (NAA), an amino acid byproduct commonly used as a marker of healthy neurons. The rate of blood flow is particularly important because active parts of the brain need the most oxygen and nutrients to function properly.
The subjects were also evaluated using standardized Autism Diagnostic Observation Schedule (ADOS) scores, which help diagnose and measure the degree of autism severity.
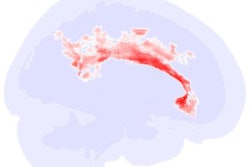
Peterson and colleagues found increased blood flow or hyperperfusion -- indicating more brain activity -- throughout large portions of white matter in the subjects with autism spectrum disorder. This heightened rCBF also correlated with ADOS scores. In other words, hyperperfusion was associated with more severe autism.
Peterson explained the greater brain activity as an attempt by brain cells to compensate for white-matter deficiencies, which also could explain why many individuals with autism spectrum disorder can still be high-functioning.
"This correlation of perfusion and ADOS is absolutely key because it shows that the higher the blood flow, the more autism spectrum disorder symptoms the participants have," he said. "This very solidly supports the idea of compensation."
Results from NAA analyses also support the compensation theory. Lower NAA concentrations among autistic subjects correlated with higher perfusion at those points in the brain. To put it another way, areas with the lowest levels of healthy neurons exhibited the highest brain activity and blood flow.

![Overview of the study design. (A) The fully automated deep learning framework was developed to estimate body composition (BC) (defined as subcutaneous adipose tissue [SAT] in liters; visceral adipose tissue [VAT] in liters; skeletal muscle [SM] in liters; SM fat fraction [SMFF] as a percentage; and intramuscular adipose tissue [IMAT] in deciliters) from MRI. The fully automated framework comprised one model (model 1) to quantify different BC measures (SAT, VAT, SM, SMFF, and IMAT) as three-dimensional (3D) measures from whole-body MRI scans. The second model (model 2) was trained to identify standardized anatomic landmarks along the craniocaudal body axis (z coordinate field), which allowed for subdividing the whole-body measures into different subregions typically examined on clinical routine MRI scans (chest, abdomen, and pelvis). (B) BC was quantified from whole-body MRI in over 66,000 individuals from two large population-based cohort studies, the UK Biobank (UKB) (36,317 individuals) and the German National Cohort (NAKO) (30,291 individuals). Bar graphs show age distribution by sex and cohort. BMI = body mass index. (C) After the performance assessment of the fully automated framework, the change in BC measures, distributions, and profiles across age decades were investigated. Age-, sex-, and height-adjusted body composition reference curves were calculated and made publicly available in a web-based z-score calculator (https://circ-ml.github.io).](https://img.auntminnie.com/mindful/smg/workspaces/default/uploads/2026/05/body-comp.XgAjTfPj1W.jpg?auto=format%2Ccompress&fit=crop&h=100&q=70&w=100)


![Overview of the study design. (A) The fully automated deep learning framework was developed to estimate body composition (BC) (defined as subcutaneous adipose tissue [SAT] in liters; visceral adipose tissue [VAT] in liters; skeletal muscle [SM] in liters; SM fat fraction [SMFF] as a percentage; and intramuscular adipose tissue [IMAT] in deciliters) from MRI. The fully automated framework comprised one model (model 1) to quantify different BC measures (SAT, VAT, SM, SMFF, and IMAT) as three-dimensional (3D) measures from whole-body MRI scans. The second model (model 2) was trained to identify standardized anatomic landmarks along the craniocaudal body axis (z coordinate field), which allowed for subdividing the whole-body measures into different subregions typically examined on clinical routine MRI scans (chest, abdomen, and pelvis). (B) BC was quantified from whole-body MRI in over 66,000 individuals from two large population-based cohort studies, the UK Biobank (UKB) (36,317 individuals) and the German National Cohort (NAKO) (30,291 individuals). Bar graphs show age distribution by sex and cohort. BMI = body mass index. (C) After the performance assessment of the fully automated framework, the change in BC measures, distributions, and profiles across age decades were investigated. Age-, sex-, and height-adjusted body composition reference curves were calculated and made publicly available in a web-based z-score calculator (https://circ-ml.github.io).](https://img.auntminnie.com/mindful/smg/workspaces/default/uploads/2026/05/body-comp.XgAjTfPj1W.jpg?auto=format%2Ccompress&dpr=2&fit=crop&h=167&q=70&w=250)


