

Measurements of the urethra seen on MRI exams prior to surgery may predict urinary continence in men after prostatectomy, according to a study published January 18 in Radiology.
Researchers at the University of Michigan in Ann Arbor looked at outcomes in men who underwent radical prostatectomy and found coronal membranous urethra length on preoperative prostate MRI scans was an independent predictor of continence.
"A longer membranous urethra length was a significant independent predictor of continence at three, six, and 12 months after [radical prostatectomy]," wrote first author Dr. Hannah Lamberg.
Urinary continence is an important factor affecting patient quality of life after radical prostatectomy. Studies have found that only 35% of men have total urinary control one year after radical prostatectomy.
The membranous urethra is the shortest and narrowest part of the urethra (1 cm to 2 cm). It runs through the pelvic floor and is enclosed by the external urethral sphincter, which may be damaged during surgery and result in sphincter weakness and incontinence.
Anatomic measures of the membranous urethra on prostate MRI exams have been previously associated with continence outcomes, but whether they have predictive ability is unclear, the author wrote.
"The ability to predict continence after [radical prostatectomy] could substantially aid physicians and patients when making treatment recommendations or decisions," the researchers stated.
In this retrospective study, the researchers culled patient-reported continence data from a Michigan registry comprising 45 diverse community and academic urology practices representing about 90% of the urologists. They included outcomes in 586 men who underwent radical prostatectomy from August 2015 to October 2019.
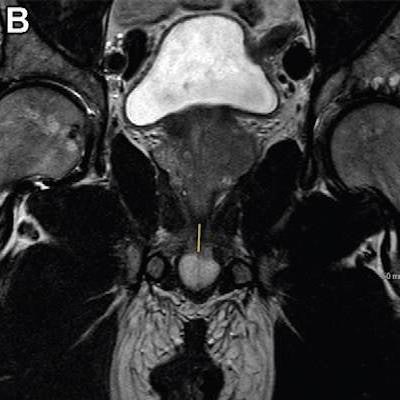
 T2-weighted fast spin-echo MRI scans in (A) sagittal view and (B, C) coronal views with (B) and without (C) annotation illustrate the membranous urethra length (MUL) measurement technique. MUL was defined as the distance from the prostate apex to the urethral entry into the penile bulb. The yellow line in A and B represents the MUL. Images courtesy of Radiology.
Preoperative MRI-based anatomic measures were obtained by four abdominal radiologists. The membranous urethra length was measured in the coronal and sagittal planes and defined as the distance from the prostate apex to the urethral entry into the penile bulb.
Logistic regression models were developed with clinical variables alone, MRI variables alone, and combined variables for predicting continence at three, six, and 12 months after surgery. Patient use of adult diapers or more than one urinary pad per day defined incontinence.
The analysis showed the proportion of patients with incontinence was 0.2% at baseline, 27% at three months, 14% at six months, and 9% at 12 months. Longer coronal membranous urethra length improved the odds of postradical prostatectomy continence at all time points in models that incorporated both clinical and MRI predictors, according to the findings.
No other MRI variables were predictive, the researchers found. Age and baseline urinary function score were the only other predictive clinical variables at every time point.
"For each 1-mm increase in coronal [membranous urethra length], the odds of continence increased by 14% (3 months) to 21% (12 months)," the authors reported.
In other words, a longer preoperative membranous urethra length increases the likelihood of postradical prostatectomy continence recovery, the researchers wrote. Among clinical variables, older age and lower baseline urinary function scores were the most consistent predictors of incontinence, they added.
Ultimately, a comprehensive assessment of membranous urethra length in conjunction with clinical parameters and other potential MRI-based anatomic measures will be needed to determine its usefulness in routine clinical care, the researchers noted.
"Development of a continence nomogram in an independent validation cohort that incorporates clinical and MRI measures could guide patients and providers considering prostate cancer treatment options," the group concluded.


![Overview of the study design. (A) The fully automated deep learning framework was developed to estimate body composition (BC) (defined as subcutaneous adipose tissue [SAT] in liters; visceral adipose tissue [VAT] in liters; skeletal muscle [SM] in liters; SM fat fraction [SMFF] as a percentage; and intramuscular adipose tissue [IMAT] in deciliters) from MRI. The fully automated framework comprised one model (model 1) to quantify different BC measures (SAT, VAT, SM, SMFF, and IMAT) as three-dimensional (3D) measures from whole-body MRI scans. The second model (model 2) was trained to identify standardized anatomic landmarks along the craniocaudal body axis (z coordinate field), which allowed for subdividing the whole-body measures into different subregions typically examined on clinical routine MRI scans (chest, abdomen, and pelvis). (B) BC was quantified from whole-body MRI in over 66,000 individuals from two large population-based cohort studies, the UK Biobank (UKB) (36,317 individuals) and the German National Cohort (NAKO) (30,291 individuals). Bar graphs show age distribution by sex and cohort. BMI = body mass index. (C) After the performance assessment of the fully automated framework, the change in BC measures, distributions, and profiles across age decades were investigated. Age-, sex-, and height-adjusted body composition reference curves were calculated and made publicly available in a web-based z-score calculator (https://circ-ml.github.io).](https://img.auntminnie.com/mindful/smg/workspaces/default/uploads/2026/05/body-comp.XgAjTfPj1W.jpg?auto=format%2Ccompress&fit=crop&h=100&q=70&w=100)


![Overview of the study design. (A) The fully automated deep learning framework was developed to estimate body composition (BC) (defined as subcutaneous adipose tissue [SAT] in liters; visceral adipose tissue [VAT] in liters; skeletal muscle [SM] in liters; SM fat fraction [SMFF] as a percentage; and intramuscular adipose tissue [IMAT] in deciliters) from MRI. The fully automated framework comprised one model (model 1) to quantify different BC measures (SAT, VAT, SM, SMFF, and IMAT) as three-dimensional (3D) measures from whole-body MRI scans. The second model (model 2) was trained to identify standardized anatomic landmarks along the craniocaudal body axis (z coordinate field), which allowed for subdividing the whole-body measures into different subregions typically examined on clinical routine MRI scans (chest, abdomen, and pelvis). (B) BC was quantified from whole-body MRI in over 66,000 individuals from two large population-based cohort studies, the UK Biobank (UKB) (36,317 individuals) and the German National Cohort (NAKO) (30,291 individuals). Bar graphs show age distribution by sex and cohort. BMI = body mass index. (C) After the performance assessment of the fully automated framework, the change in BC measures, distributions, and profiles across age decades were investigated. Age-, sex-, and height-adjusted body composition reference curves were calculated and made publicly available in a web-based z-score calculator (https://circ-ml.github.io).](https://img.auntminnie.com/mindful/smg/workspaces/default/uploads/2026/05/body-comp.XgAjTfPj1W.jpg?auto=format%2Ccompress&dpr=2&fit=crop&h=167&q=70&w=250)


