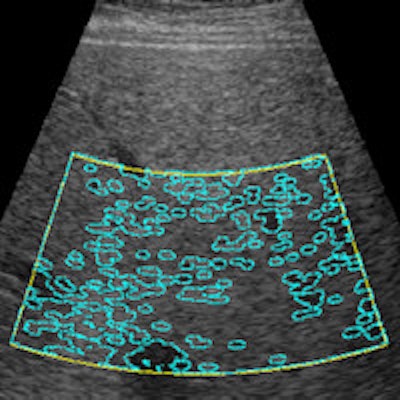
A computer-aided ultrasound technique can be used to stage liver steatosis, or fatty liver, offering high correlation with fat measurements produced from MR spectroscopy, according to a pilot study from Radboud University Medical Center in Nijmegen, the Netherlands.
In research published in the March issue of Ultrasound in Medicine and Biology, a computer-aided ultrasound protocol developed by the institution yielded similar performance to MR spectroscopy measurements of liver fat in patients on home parenteral nutrition. The method shows promise as a noninvasive, easy, inexpensive alternative to invasive biopsies or expensive MR spectroscopy techniques, lead author Gert Weijers told AuntMinnie.com.
"By simply using a calibrated ultrasound machine and our software, a noninvasive, easily applicable method for staging liver steatosis is obtained, which might in the future prevent biopsies," Weijers said.
Animal tests
The group began developing its computer-aided ultrasound protocol in 2007, when veterinarians from the University of Veterinary Medicine Hannover in Hannover, Germany, contacted Radboud's Medical Ultrasound Imaging Center (MUSIC) to make use of the group's experience in quantitative ultrasound, Weijers said. Traditionally, quantitative ultrasound analysis had been performed on radiofrequency data; B-mode images were evaluated only qualitatively.
"Since many cows suffer from steatosis during early lactation (with high risk for comorbidity) and only commercial equipment was available, [the veterinarians] suggested the use of B-mode images for quantitative analysis," Weijers said. "We were [immediately] interested and saw the potential to develop a method that could also be used for human liver screening. Since every ultrasound modality nowadays produces a digital image output, the method might be generally applied to almost all ultrasound imaging facilities."
The protocol has four steps, the first of which involves calibrating the ultrasound equipment via a tissue-mimicking phantom. Using information gathered from this calibration, the group's software then preprocesses ultrasound images to achieve pure logarithmically encoded echo levels.
"This is required to be able to perform quantitative analysis," Weijers said.
Next, the software applies a back-scan conversion to align the ultrasound data and to compensate for the depth dependence of the ultrasound beam and the attenuation caused by superficial tissue layers, he said. Finally, the software automatically calculates a region of interest, from which large blood vessels and the bile ducts can be segmented. Several quantitative features are extracted and calculated, such as mean echo level, standard deviation and signal-to-noise ratio of the echo levels, depth dependence of the mean echo level, and axial and lateral speckle size.
Measured in decibels per centimeter, the residual attenuation coefficient quantifies the level of ultrasound signal attenuation, corrected for the normal depth dependency of liver images. The higher the residual attenuation coefficient, the higher the liver fat content due to the increase in backscatter and attenuation from fat, according to the researchers.
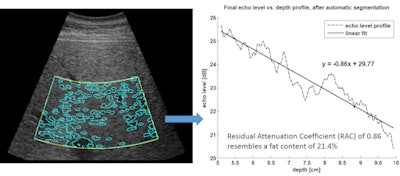 Computer-assisted ultrasound software automatically marks the region of interest (yellow lines) and performs automatic segmentation (blue lines). The resulting echo level versus depth profile enables calculation of the residual attenuation coefficient and estimation of fat content percentage. Image courtesy of Gert Weijers.
Human testing
Following previous testing that validated the technique's performance in cows, the researchers sought to assess the method in humans -- specifically in patients on home parenteral nutrition. Due partly to the accumulation of lipids in the liver, patients being fed intravenously at home are at risk for developing liver dysfunction and may progress to end-stage liver disease with overt liver failure. As a result, it's critical to have a timely diagnosis and the ability to easily perform repeated assessment of liver steatosis, according to the researchers (Ultrasound Med Biol, March 2016, Vol. 42:3, pp. 637-644).
MR spectroscopy has been shown in the literature to be highly accurate for detecting fat content, so the group sought to compare their computer-assisted ultrasound technique with MR spectroscopy measurements on 14 patients who had been on home parenteral nutrition for an average of eight years (range, 1-33 years). The patients had an average age of 50 years (range, 20-64 years).
Ultrasound radiofrequency data were acquired using a Sonos 7500 scanner (Philips Healthcare) with a 3- to 8-MHz phased-array transducer, with data converted to conventional B-mode images; five independent images were captured at the intercostals position during breath-holding at the end of the breathing cycle, according to the group. A 3-tesla MRI scanner (Magnetom Trio with Tim, Siemens Healthcare) was used to acquire MR images of the whole liver and then perform reference MR spectroscopy measurements.
Computer-assisted ultrasound measurements were performed on each of the five acquired ultrasound images. Based on the results, the researchers categorized the patients into one of two groups: no or low fat versus moderate or severe fat.
Four parameters calculated by computer-assisted ultrasound had a statistically significant correlation with MR spectroscopy fat measurements, but residual attenuation coefficient correlated the best:
- Residual attenuation coefficient: r = 0.921 (p < 0.01)
- Lateral speckle width: r = 0.778 (p < 0.021)
- Signal-to-noise ratio of echo levels: r = 0.599 (p < 0.05)
- Mean echo level: r = 0.650 (p < 0.05)
- Axial speckle width: r = 0.524
- Standard deviation: r = 0.198
The pilot study's results in humans were perfectly in accordance with the prior research in cows, showing significant correlations with MR spectroscopy fat content measurements, according to Weijers.
"[The study] revealed that we can determine the liver fat content with high sensitivity and specificity," he said. "The most valuable quantitative information lies within the depth dependence of the ultrasound parameters."
Next steps
The researchers are now evaluating their quantitative ultrasound method in two large human cohorts to determine its sensitivity and specificity for steatosis screening, Weijers said.
In addition, the group is widening its scope to be able to cover the whole disease spectrum of nonalcoholic fatty liver disease, including steatosis, fibrosis, and cirrhosis.
"The [computer-aided ultrasound] method is also implemented and under research in [musculoskeletal] ultrasound and used for the prediction of plasma progesterone concentrations in the estrous cycle in cows," he said. "However, the protocol can easily be adapted to other organs with a reasonable volume."
Weijers noted that the computer-aided ultrasound software could be used with any ultrasound system that provides digital DICOM output.
"We are open to collaborating with other groups by making the [computer-assisted ultrasound] software available," he said.

