What factors influence the number of diagnostic imaging exams ordered for inpatients in children's hospitals in the U.S.? A statistical analysis of nearly 1.5 million pediatric inpatients conducted by researchers at Children's Hospital Boston generated more questions than answers.
Study findings presented by pediatric radiology resident Dr. Ryan Arnold intrigued attendees at the Society for Pediatric Radiology (SPR) annual meeting in Boston held April 13-17. A detailed analysis of more than 3.6 million radiology exams performed over a 2.5-year period at 39 pediatric hospitals located throughout the U.S. identified but failed to explain 65% of the differences in imaging utilization among hospitals.
The study also identified a wide disparity in procedure cost on a hospital-by-hospital basis, which could not be attributed to geographic location or hospital size. It underscored the fact that items not captured by statistics, such as hospital culture, medicolegal concerns, and physician training, may significantly influence the number of imaging procedures ordered and the costs at which they are billed.
Optimum level of imaging
The research team's objectives were to identify the optimum level of imaging for pediatric inpatients based on type and severity of illness, and determine how closely Children's Hospital Boston met the norm and could better optimize its own utilization patterns.
The researchers obtained data about all radiology procedures performed between July 2006 and December 2008 at 39 not-for-profit tertiary care pediatric hospitals that submitted data to the Pediatric Health Information System (PHIS). The PHIS administrative database, which collects inpatient, emergency department, ambulatory surgery, and observational data, is administered by the Child Health Corporation of America in Shawnee Mission, KS, a business alliance of children's hospitals.
For purposes of external benchmarking, participating hospitals also provide discharge and encounter data, including demographics, diagnoses, and procedures, and resource utilization data, such as prescription drugs, laboratory tests, and diagnostic imaging procedures ordered.
The researchers obtained information on 1.5 million inpatients and 3.6 million imaging exams, and evaluated the studies based on geographic area and hospital size. They also evaluated patient type, based on whether the patient was admitted to an intensive care unit, a neonatal intensive care unit, or a ward. Severity of the illnesses of the children for which the procedures were performed was also analyzed and measured by case mix index; researchers used a standardized five-point scale based on the severity of illness determined by diagnosis.
While the researchers found was some variation in the number of average procedures per inpatient stay by geographic region and by hospital size, neither of these factors were statistically significant. Length of stay was statistically significant, with the greater the number of procedures correlating with the length of admission.
Imaging utilization for all patients was a median 1.7 exams per patient, ranging from 0.7 to 2.6 exams. Children's Hospital Boston averaged 2.0 exams per patient.
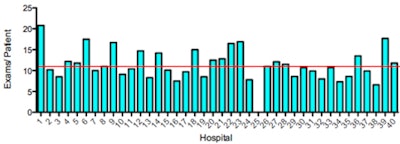
As might be expected, imaging utilization increased significantly for patients in intensive care units. The median number of procedures was 10.7 exams, ranging from 6.6 to 20.8 exams. Eighteen percent of the reporting hospitals performed an average of more than 15 exams for each intensive care unit patient, and nearly 40% performed 10 or fewer procedures. Children's Hospital Boston averaged 13.5 exams.
The greatest difference in imaging utilization was with neonatal intensive care infants. The median number of procedures performed was 17.7 exams. However, the average ranged from a low of 9.2 exams to a high of 47.2 exams, with Children's Hospital Boston averaging 18.1 procedures.
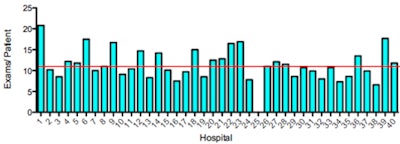 |
| Intensive care unit -- imaging utilization by patient type. Images courtesy of Dr. Gregory Taylor and Dr. Ryan Arnold. |
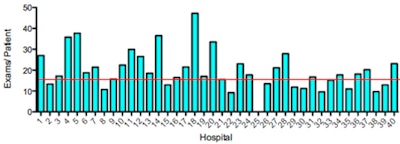 |
| Neonatal intensive care unit -- imaging utilization by patient type. |
The researchers tried to normalize utilization based on severity of illness, and verified that the hospitals with the sickest patients performed the most procedures. "However, this variation accounted for only 35% of the variability," Ryan said. "Sixty-five percent of the variability among hospitals could not be explained by how sick the patients were. When we compared two patients with the same illness at the same severity level, depending upon at which hospital the patient was treated there could be a twofold variation in the number of imaging procedures ordered."
The most significant variation was cost. "We identified a significant amount of cost variability that had no relation to a hospital's geographic location or size. Imaging costs normalized for case mix index-adjusted utilization ranged from a low of $79.00 per patient to a high of $432.60 per patient. We were pleased that Boston Children's Hospital's average was $281.78, close to the median average of $233.70," Arnold noted.
"Our analysis ... made us realize that while we identified case mix index and length of stay as drivers for imaging utilization, information not captured by statistics, such as the way that a physician has been trained, and a hospital's culture relating to ordering as few radiology exams as necessary ... must play significant roles," Arnold explained.
"Evidence-based appropriateness criteria are urgently needed to guide decisions relating to the ordering of radiology exams for children," he concluded.
By Cynthia E. Keen
AuntMinnie.com staff writer
April 23, 2010
Related Reading
Study offers more nuanced views of U.S. imaging use rates, March 22, 2010
Putting informatics data to work for decision support, November 30, 2009
NEJM study: Imaging procedures, radiation growing, August 26, 2009
Decision-support software cuts imaging procedure volume, March 24, 2009
Copyright © 2010 AuntMinnie.com


