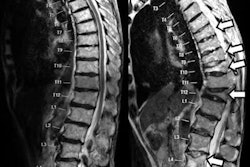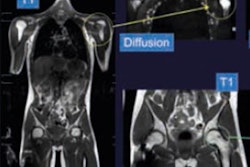
A new multipurpose computer-aided detection (CAD) algorithm was able to detect and characterize different kinds of spinal metastases in PET/CT images automatically and accurately, say researchers from two U.S. institutions. The fully automated system could help doctors diagnose and manage patients with the most common musculoskeletal metastases.
The study was based on PET/CT images of 53 patients with lytic, sclerotic, and mixed spinal lesions that were classified by means of a multiclassifier quantitative analysis system, said Dr. Ronald Summers, PhD, from the U.S. National Institutes of Health (NIH), in a presentation at RSNA 2016.
"We developed a CAD system that detects metastases of vertebral bodies using a synthesis of CT images for the purpose of detecting sclerotic lesions, but also mixed or difficult lesions," he said. "It mimics routine clinical visual inspection and diagnosis and improves detection sensitivity."
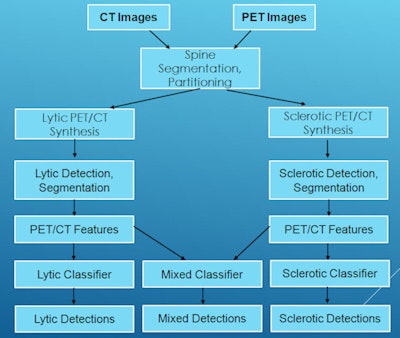 Spinal metastasis CAD system flowchart. All images courtesy of Dr. Ronald Summers, PhD.
Necessary tool, long-term goal
Automated detection, characterization, and measurement of skeletal lesions on CT and PET images has been a long-term goal of the NIH research lab, Summers said. A previous study by the group succeeded in detecting lytic and sclerotic lesions separately, but some lesions have both lytic and sclerotic components, hence the need for a system that characterizes both.
The current project, led by Dr. Joseph Burns, PhD, and colleagues from the University of California, Irvine, in cooperation with Summers and Dr. Jianhua Yao at the NIH, aimed to develop a fully automated CAD system to detect spinal metastases on FDG-PET/CT images.
The spine is the most frequent location of skeletal metastases. Therefore, the CAD algorithm is focused on thoracolumbar vertebral bodies, which are the most common spinal metastases, Summers said.
"It's very common for patients to have bone metastases," he said, noting that about 400,000 patients a year are diagnosed with a metastasis, and about 70% of all patients with breast and prostate cancer develop metastases. Half of these patients develop secondary skeletal complications such as pathological fractures, bone pain, neurocompression, and hematopoietic and metabolic abnormalities.
The algorithm was tested on a database that included PET/CT images from 53 patients (mean age, 53 years) with lytic, sclerotic, or mixed lesion types. Section thickness was 3.75 mm for the clinically obtained images, representing 225 lytic, 139 sclerotic, and 92 mixed lesions. Exclusion criteria ruled out patients with spinal hardware, vertebroplasty cement, or significant artifacts.
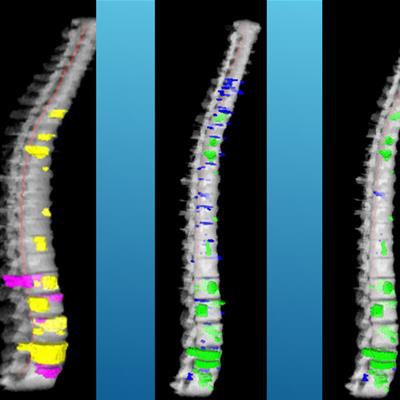
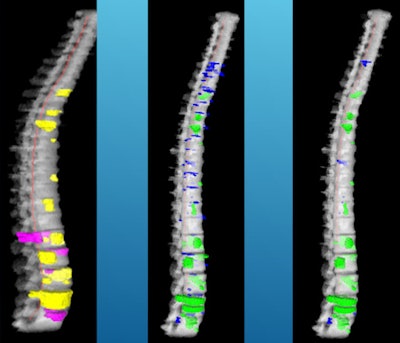 CAD reference data and detections. Left: reference lesions (yellow: sclerotic, cyan: lytic, purple: mixed). Middle: detections before classification. Right: detections after classification (green: true positive, blue: false positive).
The project used fused PET/CT images because they have been shown to increase tumor detection over the use of CT alone in clinical studies, Summers said. The researchers combined the modalities with the use of synthetic fused images to utilize the higher dimensional operation capability of computers.
"Our hypothesis was that the synthetic images would increase detection in a system designed to detect these three categories of lesions: sclerotic, lytic, and mixed," he said.
Synthesized images from CT and PET
Two image sets were produced for each study by integrating PET with CT data, with one set for lytic and the other for sclerotic lesions, and PET used for density amplification. Creating the synthetic images involved a simple linear transform where the original images were combined using a weighting factor that was determined empirically from a few training cases, Summers explained.
"In essence, we increased the CT attenuation of the images for sclerotic lesions and decreased the CT attenuation of the lytic lesions based on the intensity of the PET images," he said.
The detection and characterization process included spine segmentation and partitioning. Three algorithms -- watershed, graph cut, and level set -- were used to obtain initial detections. When a preliminary lytic and sclerotic detection overlapped spatially, they were merged and sent to a mixed lesion support vector machine (SVM) classifier; otherwise, they were routed to lytic and sclerotic lesion classifiers, respectively. The study team applied 10-fold cross validation to evaluate classifier performance.
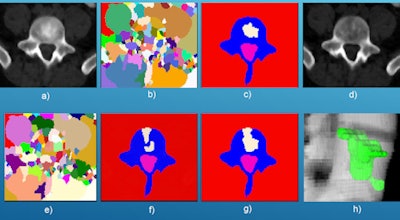 Spinal lesion candidate detection and segmentation process: (a) sclerotic synthesis of prior mixed lesion, (b) watershed for "a," (c) graph cut for "b," (d) lytic synthesis of prior mixed metastasis, (e) watershed for "d," (f) graph cut for "e," (g) merging of sclerotic and lytic detections, and (h) 3D mixed metastasis detection.
Combined modalities boost CAD performance
Among the results, sensitivity was higher and false-positive results were fewer for the synthesized PET/CT data versus CT alone, according to Summers.
| CAD of PET/CT by lesion type | ||
| Lesion type | CT alone | PET/CT |
| Sclerotic | 68% (2.2) | 81% (2.1) |
| Lytic | 65% (1.5) | 81% (1.3) |
| Mixed | 35% (2.2) | 76% (2.1) |
Detection sensitivity improved among all lesions with the use of PET/CT fused images, especially for mixed lesions.
A receiver operating characteristic (ROC) curve showed that performance of the CAD system improved significantly (p < 0.01) with synthesis of the PET images.
CAD generated 32 false-positive detections among 18 control cases, mostly due to the presence of bone islands. Spinal lesions ranged in size from 4 mm to 37 mm and were most common in T9 to T12. A few false-negative detections occurred in small lesions.


