CHICAGO -- Image-only deep-learning (DL) risk scores show changes over time in breast cancer prediction, suggest findings presented December 1 at RSNA 2025.
In her presentation, Constance Lehman, MD, from Massachusetts General Hospital in Boston showed findings from a study she and colleagues led, with the Mirai prediction model showing that these changes arise as early as four to five years before diagnosis.
“This is an opportunity to provide more predictive data than derived from a single point in time risk score for improved early detection,” Lehman said.
Traditional breast cancer risk prediction models demonstrate modest performance and are inherently static.
Prior research suggests that AI-based scores may rise years before breast cancer diagnosis. However, Lehman noted that these reflect models that are trained to identify visible findings on imaging.
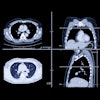
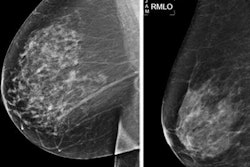
She and colleagues studied whether DL risk scores based on images only could change over time and whether trajectories differ between women who do and do not develop cancer. Mirai was trained on four-view digital screening mammograms from over 54,000 women to predict five-year future breast cancer risk. The model uses no clinical or demographic data.
The researchers analyzed 159,556 consecutive screening mammograms from women who either remained cancer-free or were diagnosed within a year of their final exam. They also included exams within six years prior to the final exam. And the researchers categorized the women into future cancer (n = 817) and cancer-free (n = 53,197) groups.
While risk scores increased over time in the future cancer group (slope = 1.13/year; 95% CI; p < .001), scores remained flat in the cancer-free group (slope = 0.09/year; p < .001). This made for a between-group slope difference of 1.04 (p < 0.001).
Additionally, DL risk scores were significantly higher in the future cancer group at each annual interval compared to the cancer-free group.
Risk scoring between cancer-free, future cancer groups | |||
Annual interval | Cancer-free group | Future cancer group | P value |
5 to 6 years | 1.8 | 2.1 | 0.003 |
4 to 5 years | 2.0 | 2.3 | <0.001 |
3 to 4 hours | 2.1 | 2.8 | <0.001 |
2 to 3 hours | 2.1 | 2.7 | <0.001 |
1 to 2 hours | 2.1 | 3.2 | <0.001 |
Final exam | 2.2 | 6.6 | <0.001 |
Finally, Lehman reported that across all subgroups, the interaction between cancer status and time remained statistically robust. This confirms that divergent risk score trajectories were consistent across strata defined by age and breast density, she added.
She said that this approach could help with the development of more effective interventions to prevent cancer, “tailored to the individual woman’s response.”
“This may serve as an intermediate marker of cancer risk to support more rapid and more effective drug development in the domain of chemoprevention of breast cancer,” she said.
Visit our RADCast for full coverage of RSNA 2025.